0
关注
172
关注者
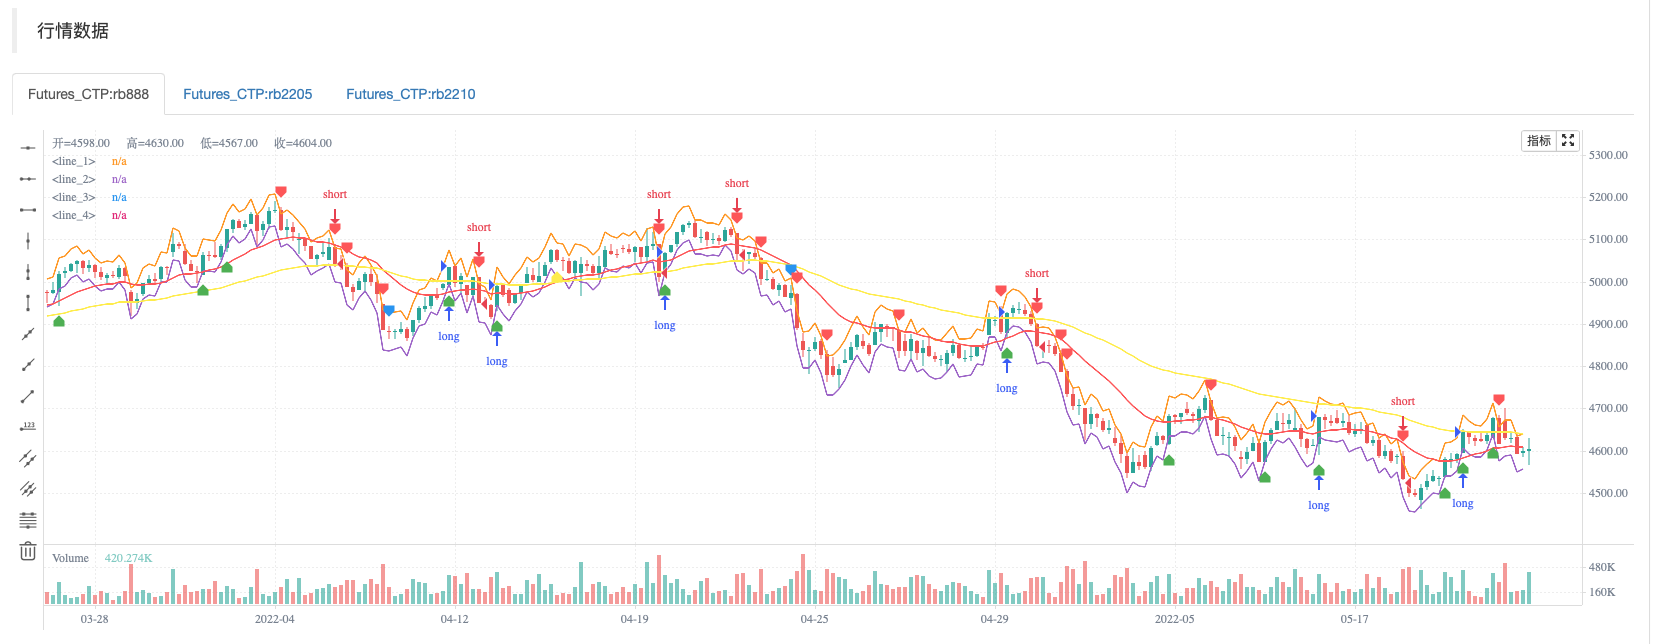
该策略基于RSI和ATR波段,在5分钟和15分钟的时间范围内效果更好。我还添加了65和21均线的黄金交叉点,以确认趋势。
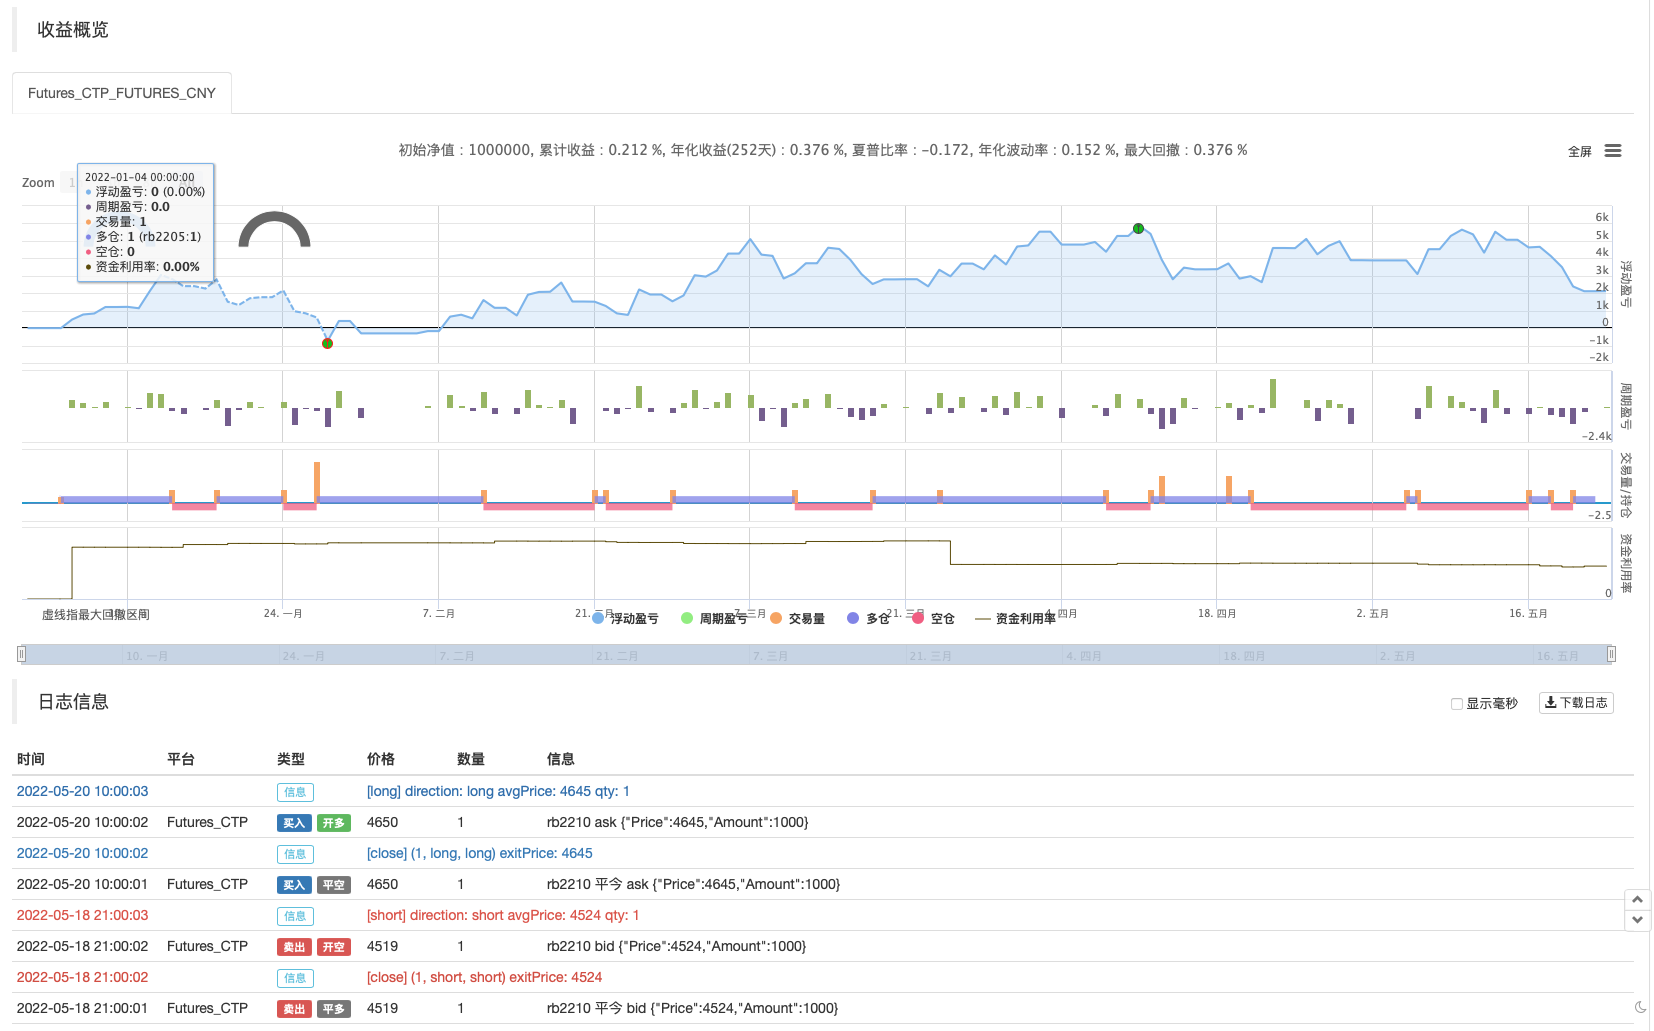
回测测试


策略源码
/*backtest
start: 2022-01-01 09:00:00
end: 2022-05-23 15:00:00
period: 1h
basePeriod: 15m
exchanges: [{"eid":"Futures_CTP","currency":"FUTURES"}]
args: [["ContractType","rb888",360008]]
*/

//@version=4
strategy("Super Scalper - 5 Min 15 Min", overlay=true)
source = close
atrlen = input(14, "ATR周期")
mult = input(1, "ATR乘数", step=0.1)
smoothing = input(title="ATR Smoothing", defval="RMA", options=["RMA", "SMA", "EMA", "WMA"])
ma_function(source, atrlen) =>
    if smoothing == "RMA"
        rma(source, atrlen)
    else
        if smoothing == "SMA"
            sma(source, atrlen)
        else
            if smoothing == "EMA"
                ema(source, atrlen)
            else
                wma(source, atrlen)
atr_slen = ma_function(tr(true), atrlen)
upper_band = atr_slen * mult + close
lower_band = close - atr_slen * mult

// Create Indicator's
shortSMA = ema(close, 21)
longSMA = ema(close, 65)
rsi = rsi(close, 14)
atr = atr(14)

// Specify  conditions
longCondition = open < lower_band
shortCondition = open > upper_band
GoldenLong = crossover(shortSMA,longSMA)
Goldenshort = crossover(longSMA,shortSMA)

plotshape(shortCondition, title="Sell Label", text="Sell", location=location.abovebar, style=shape.labeldown, size=size.tiny, color=color.red, textcolor=color.white, transp=0)
plotshape(longCondition, title="Buy Label", text="Buy", location=location.belowbar, style=shape.labelup, size=size.tiny, color=color.green, textcolor=color.white, transp=0)
plotshape(Goldenshort, title="Golden Sell Label", text="Golden Crossover Short", location=location.abovebar, style=shape.labeldown, size=size.tiny, color=color.blue, textcolor=color.white, transp=0)
plotshape(GoldenLong, title="Golden Buy Label", text="Golden Crossover Long", location=location.belowbar, style=shape.labelup, size=size.tiny, color=color.yellow, textcolor=color.white, transp=0)
// Execute trade if condition is True
if (longCondition)
    stopLoss = low - atr * 2
    takeProfit = high + atr * 5
    strategy.entry("long", strategy.long, when = rsi > 50)


else if (shortCondition)
    stopLoss = high + atr * 2
    takeProfit = low - atr * 5
    strategy.entry("short", strategy.short, when = rsi < 50)


// Plot ATR bands to chart

////ATR Up/Low Bands

plot(upper_band)
plot(lower_band)

// Plot Moving Averages
plot(shortSMA, color = color.red)
plot(longSMA, color = color.yellow)
相关推荐
- zdmre的RSI策略
- 二重超级趋势
- RSI MTF Ob+Os策略
- 吊灯出场
- baguette by multigrain 策略
- VuManChu密码B + 差异策略
- RSI和BBand同时超卖
- 枢轴点超级趋势
- BB-RSI-ADX指标入场点策略
- SMA指标杀手策略
更多内容