成交量加速定向能量比(VADER)利用价格变动(位移)和相关成交量(力度)来估计幕后的正(买入)和负(卖出)“能量”,使交易者能够更详细地“解读市场行为”,并相应地调整其交易决策。
VADER是怎么工作的? 我一直是技术分析概念的粉丝,这些概念很简单,并且将价格行为和交易量结合在一起——维德背后的概念其实很简单。
让我们来看看它,避免太过技术化: 与大宗交易相关的大宗价格变动意味着买家(如果涨价)或卖家(如果涨价)都是认真的,并且“控制”了交易 另一方面,当价格波动很小但成交量很大时,这意味着在买入和卖出之间存在一场斗争,或更多的能量平衡。 此外,当大宗价格变动与相对有限的成交量相关联时,买家或卖家都缺乏“能量”——像这样的变动通常是短暂的。
与VADER的类比是,我们将价格波动(2 bar之间的收盘变化)视为位移(或动作结果),将相关的交易量视为该动作背后的“作用力”——将位移和作用力这两个值结合在一起,为我们提供了潜在能量(在特定方向)的表示或代理。 当两个值(位移和作用力)都较高时,则产生的能量较高-如果其中一个值较低,则产生的能量较低。
然后,我们取每个方向上的相对能量的平均值(正=买入,负=卖出),并计算净能量。
请注意,我们是从交易的角度来进行类比,而不是从物理学的角度:)–我们需要明白,物理学中的能量计算是不同的。


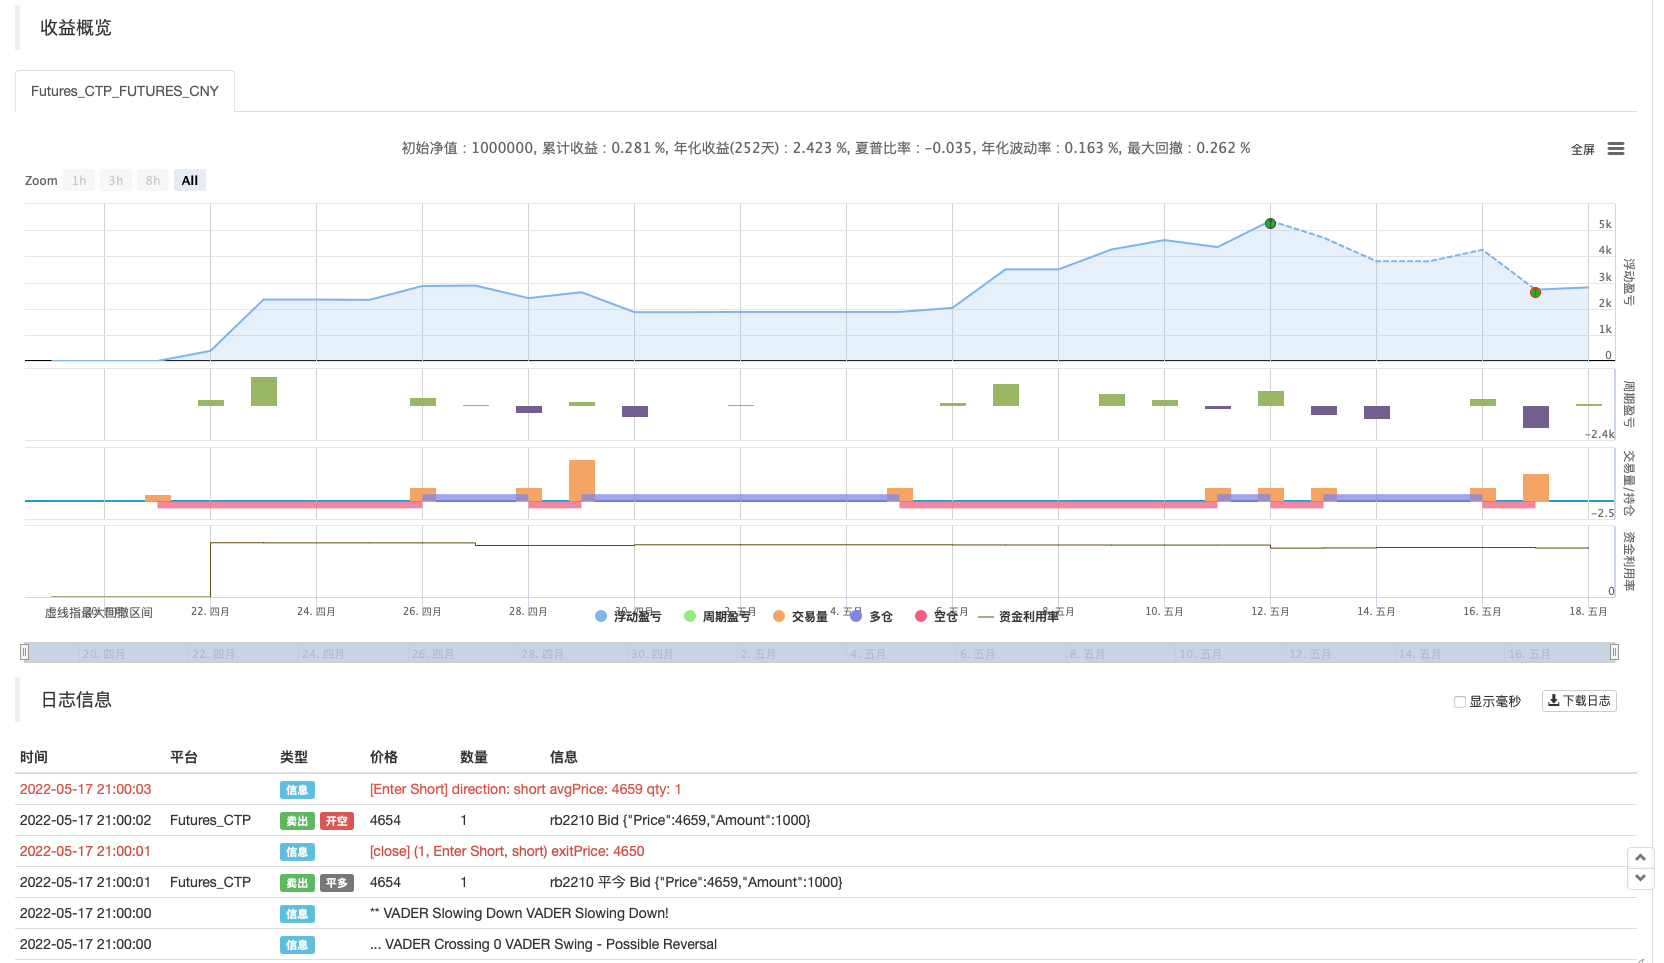
策略源码
/*backtest
start: 2022-04-19 09:00:00
end: 2022-05-18 15:00:00
period: 1h
basePeriod: 15m
exchanges: [{"eid":"Futures_CTP","currency":"FUTURES"}]
args: [["ContractType","rb888",360008]]
*/


// This source code is subject to the terms of the Mozilla Public License 2.0 at https://mozilla.org/MPL/2.0/
// © RedKTrader

//@version=5
indicator('RedK Volume-Accelerated Directional Energy Ratio', 'RedK VADER v3.0', precision=0, timeframe='', timeframe_gaps=false)

// ***********************************************************************************************************
// Choose volume calculation method.. Relative vs full.
// Relative magnifies effect of recent volume spikes (up or down)
f_RelVol(_value, _length) =>
    min_value = ta.lowest(_value, _length)
    max_value = ta.highest(_value, _length)
    ta.stoch(_value, max_value, min_value, _length) / 100
// ***********************************************************************************************************

// ***********************************************************************************************************
// Choose MA type for the base DER calculation ..
// WMA is my preference and is default .. SMA is really slow and lags a lot - but added for comparison
f_derma(_data, _len, MAOption) =>
    value =
      MAOption == 'SMA' ? ta.sma(_data, _len) :
      MAOption == 'EMA' ? ta.ema(_data, _len) :
      ta.wma(_data, _len)
// ***********************************************************************************************************


// ===========================================================================================================
//      Inputs
// ===========================================================================================================

price   = close
length  = input.int(6, '周期', minval=1)
DER_avg = input.int(5, '均值', minval=1, inline='DER', group='方向能量比')
MA_Type = input.string('WMA', 'DER MA 类型', options=['WMA', 'EMA', 'SMA'], inline='DER', group='方向能量比')
smooth  = input.int(3, '平滑', minval=1,  inline='DER_1', group='方向能量比')

show_senti = input.bool(false, '显示观点',  inline='DER_s', group='方向能量比')
senti   = input.int(20, '观点周期', minval=1, inline='DER_s', group='方向能量比')


v_calc  = input.string('Relative', '计算选项', options=['Relative', 'Full', 'None'], group='成交量参数')
vlookbk = input.int(10, '回看周期 (相对的)', minval=1,                            group='成交量参数')

// ===========================================================================================================
//          Calculations
// ===========================================================================================================

// Volume Calculation Option  -- will revert to no volume acceleration for instruments with no volume data
vola    =
  v_calc == 'None' or na(volume) ? 1 :
  v_calc == 'Relative' ? f_RelVol(volume, vlookbk) :
  volume

R       = (ta.highest(2) - ta.lowest(2)) / 2                    // R is the 2-bar average bar range - this method accomodates bar gaps
sr      = ta.change(price) / R                                  // calc ratio of change to R
rsr     = math.max(math.min(sr, 1), -1)                         // ensure ratio is restricted to +1/-1 in case of big moves
c       = fixnan(rsr * vola)                                    // add volume accel -- fixnan adresses cases where no price change between bars

c_plus  = math.max(c, 0)                                        // calc directional vol-accel energy
c_minus = -math.min(c, 0)

// plot(c_plus)
// plot(c_minus)


avg_vola    = f_derma(vola, length, MA_Type)
dem         = f_derma(c_plus, length, MA_Type)  / avg_vola          // directional energy ratio
sup         = f_derma(c_minus, length, MA_Type) / avg_vola

adp         = 100 * ta.wma(dem, DER_avg)                            // average DER
asp         = 100 * ta.wma(sup, DER_avg)
anp         = adp - asp                                             // net DER..
anp_s       = ta.wma(anp, smooth)

// Calculate Sentiment - a VADER for a longer period and can act as a baseline (compared to a static 0 value)
// note we're not re-calculating vol_avg, demand or supply energy for sentiment. this would've been a different approach
s_adp       = 100 * ta.wma(dem, senti)                            // average DER for sentiment length
s_asp       = 100 * ta.wma(sup, senti)
V_senti     = ta.wma(s_adp - s_asp, smooth)


// ===========================================================================================================
//      Colors & plots
// ===========================================================================================================
c_adp   = color.new(color.aqua, 30)
c_asp   = color.new(color.orange, 30)
c_fd    = color.new(color.green, 80)
c_fs    = color.new(color.red, 80)
c_zero  = color.new(#ffee00, 70)

c_up    = color.new(#359bfc, 0)
c_dn    = color.new(#f57f17, 0)

c_sup   = color.new(#33ff00, 80)
c_sdn   = color.new(#ff1111, 80)
up      = anp_s >= 0
s_up    = V_senti >=0

hline(0, 'Zero Line', c_zero, hline.style_solid)

// =============================================================================
// v3.0 --- Sentiment will be represented as a 4-color histogram
c_grow_above = #1b5e2080
c_grow_below = #dc4c4a80
c_fall_above = #66bb6a80
c_fall_below = #ef8e9880

sflag_up = math.abs(V_senti) >= math.abs(V_senti[1])

plot(show_senti ? V_senti : na, "Sentiment", style=plot.style_columns,
 color = s_up ? (sflag_up ? c_grow_above : c_fall_above) :
 sflag_up ? c_grow_below : c_fall_below)
// =============================================================================

s = plot(asp, 'Supply Energy', c_asp, 2, style=plot.style_circles,  join=true)
d = plot(adp, 'Demand Energy', c_adp, 2, style=plot.style_cross,    join=true)
fill(d, s, adp > asp ? c_fd : c_fs)

plot(anp, 'VADER', color.new(color.gray, 30), display=display.none)
plot(anp_s, 'Signal', up ? c_up : c_dn, 3)

// ===========================================================================================================
//      v2.0 adding alerts
// ===========================================================================================================

Alert_up    = ta.crossover(anp_s,0)
Alert_dn    = ta.crossunder(anp_s,0)
Alert_swing = ta.cross(anp_s,0)

// "." in alert title for the alerts to show in the right order up/down/swing
alertcondition(Alert_up,    ".   VADER Crossing 0 Up",      "VADER Up - Buying Energy Detected!")
alertcondition(Alert_dn,    "..  VADER Crossing 0 Down",    "VADER Down - Selling Energy Detected!")
alertcondition(Alert_swing, "... VADER Crossing 0",         "VADER Swing - Possible Reversal")

// ===========================================================================================================
//      v3.0 more alerts for VADER crossing Sentiment
// ===========================================================================================================

v_speedup = ta.crossover(anp_s, V_senti)
v_slowdn  = ta.crossunder(anp_s, V_senti)
alertcondition(v_speedup,   "*  VADER Speeding Up",      "VADER Speeding Up!")
alertcondition(v_slowdn,    "** VADER Slowing Down",    "VADER Slowing Down!")


if Alert_up
    strategy.entry("Enter Long", strategy.long)
else if Alert_dn
    strategy.entry("Enter Short", strategy.short)
相关推荐