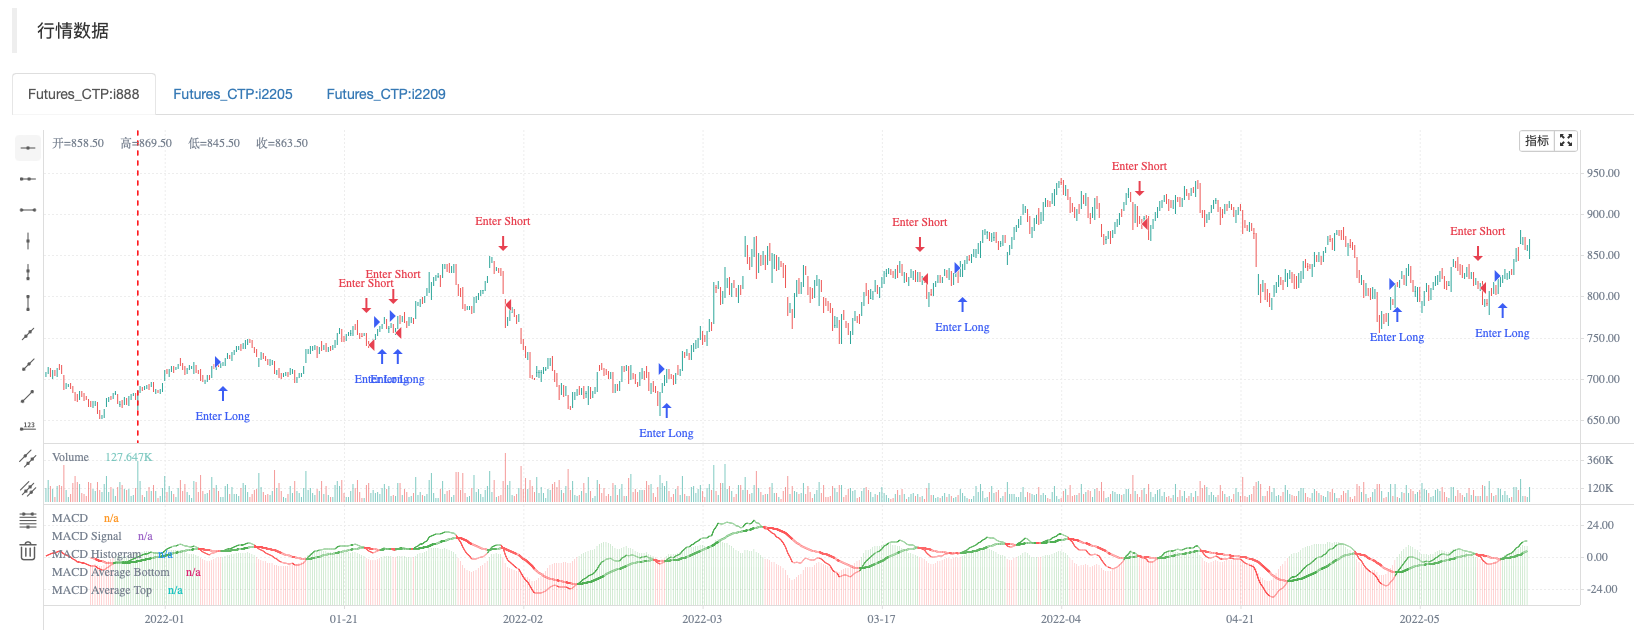
具有平均峰值线和倾角线的经典MACD。较浅的绿色和红色水平线分别是整个跨度的平均峰值和倾角。第二条,两条线中较粗的是高于和低于总体峰值和凹陷平均值的峰值和凹陷的平均值。填充的颜色有助于可视化这些平均值和可能的交易设置。修改MACD+平均值脚本。
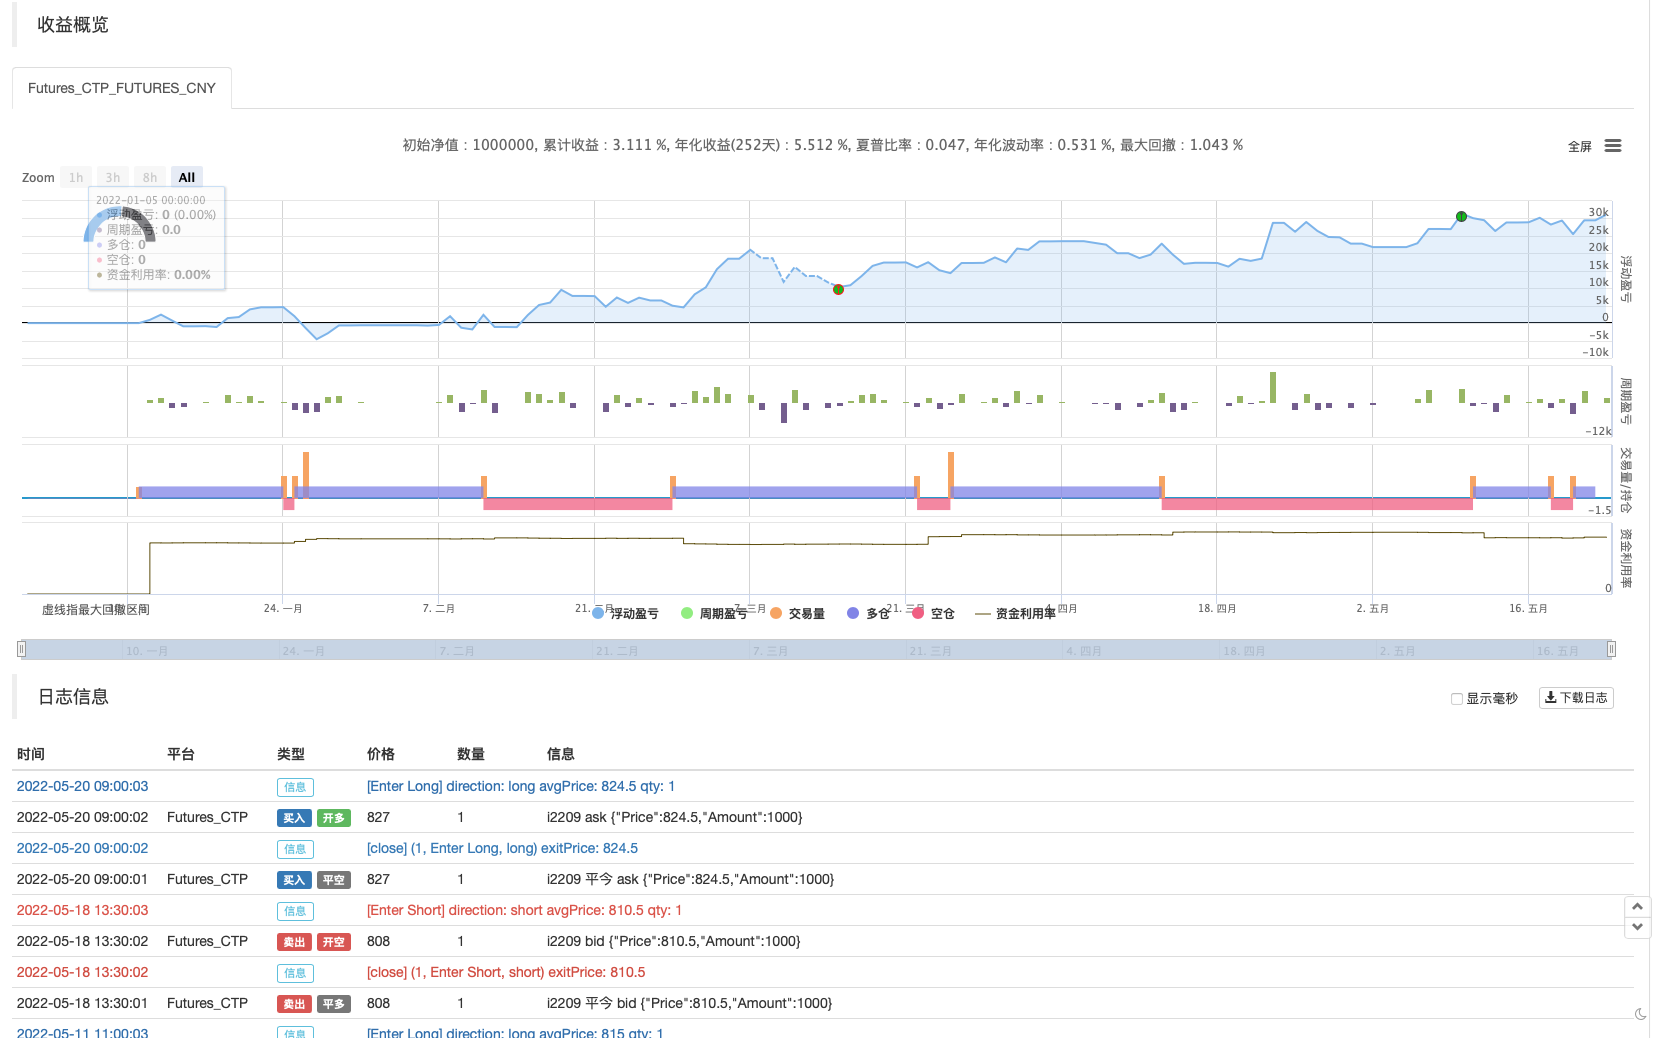
回测测试


策略源码
/*backtest
start: 2022-01-01 09:00:00
end: 2022-05-23 15:00:00
period: 1h
basePeriod: 15m
exchanges: [{"eid":"Futures_CTP","currency":"FUTURES"}]
args: [["ContractType","i888",360008]]
*/

//@version=4
//@author=Cryptonaut
//@ Cryptonaut
study("Smarter MACD", max_bars_back=500, max_labels_count=500, overlay=false, shorttitle="Smarter MACD")

///////////////////////////////////////////////////////////////////////////////////////////////////////
//  Miscellaneous block  //////////////////////////////////////////////////////////////////////////////
///////////////////////////////////////////////////////////////////////////////////////////////////////
// Inputs
showTable = input(defval=true, group="Visibility Settings", title="显示右侧监控?")

// Variables block
showMacd = true
negativeColor      = color.red
negativeColorFaded = color.new(color.red, 50)
neutralColor       = color.yellow
neutralColorFaded  = color.new(color.yellow, 50)
positiveColor      = color.green
positiveColorFaded = color.new(color.green, 50)
transparentColor   = color.new(color.white, 100)

darkTextColor  = color.black
lightTextColor = color.white

// Functions
getMa(type, src, length) =>
    float ma = 0

    if type == "EMA"
        ma := ema(src, length)
    else if type == "RMA"
        ma := rma(src, length)
    else if type == "SMA"
        ma := sma(src, length)
    else if type == "WMA"
        ma := wma(src, length)

    return = ma

// Calculations

// Plots
// SYMBOLS; ∅ ∇ ¤ ° » ↕ ↗ ↘ ↟ ↠ ↡ ∞ ∘ ∴ ∵ ∷ ⊛ ⊚ ⊙ ⊗ ⋆ ⌢ ⌣ ⌕ ⌖ ★ ✶

///////////////////////////////////////////////////////////////////////////////////////////////////////
//  MACD block  ///////////////////////////////////////////////////////////////////////////////////////
///////////////////////////////////////////////////////////////////////////////////////////////////////
//  Calculation of trend and momentum                                                                //
///////////////////////////////////////////////////////////////////////////////////////////////////////
// Inputs
macdFastMaLength = input(defval=12, group="MACD Settings", title="MACD 快线 MA 周期")
macdSlowMaLength = input(defval=26, group="MACD Settings", title="MACD 慢线 MA 周期")
macdSignalLength = input(defval=23, group="MACD Settings", title="MACD 信号 周期")

// Variables block

// Functions
getMacd(fastMaLength, slowMaLength, signalLength) =>
    fastMa      = getMa("EMA", close, fastMaLength)
    slowMa      = getMa("EMA", close, slowMaLength)
    macd        = fastMa - slowMa
    macdSignal  = getMa("EMA", macd, signalLength)
    macdHistory = macd - macdSignal

    [macd, macdSignal, macdHistory]

// Calculations
[macd, macdSignal, macdHistory] = getMacd(macdFastMaLength, macdSlowMaLength, macdSignalLength)

macdGrowAbove = positiveColor
macdFallBelow = negativeColor
macdGrowBelow = negativeColorFaded
macdFallAbove = positiveColorFaded
macdColor     = (macdHistory >= 0) ? (macdHistory[1] < macdHistory ? macdGrowAbove : macdFallAbove) : (macdHistory[1] < macdHistory ? macdGrowBelow : macdFallBelow)
macdHistColor = (macdHistory >= 0) ? (macdHistory[1] < macdHistory ? color.new(macdGrowAbove, 50) : color.new(macdFallAbove, 75)) : (macdHistory[1] < macdHistory ? color.new(macdGrowBelow, 75) : color.new(macdFallBelow, 50))

macdBot       = 0.0
macdBotPoints = 0.0
macdBots      = 0
macdTop       = 0.0
macdTopPoints = 0.0
macdTops      = 0
if not barstate.isfirst
    macdBot       := macdBot[1]
    macdBotPoints := macdBotPoints[1]
    macdBots      := macdBots[1]
    macdTop       := macdTop[1]
    macdTopPoints := macdTopPoints[1]
    macdTops      := macdTops[1]

if crossover(macdHistory, 0)
    macdBot      := macdSignal

    if macdSignal < 0
        macdBotPoints := macdBotPoints + macdSignal
        macdBots      := macdBots + 1

if crossunder(macdHistory, 0)
    macdTop      := macdSignal

    if macdSignal > 0
        macdTopPoints := macdTopPoints + macdSignal
        macdTops      := macdTops + 1

macdAvgBot = macdBotPoints/macdBots
macdAvgTop = macdTopPoints/macdTops

// Plots
macdAvgBotLine = plot(showMacd ? macdAvgBot : na, color=transparentColor, title="MACD Average Bottom")
macdAvgTopLine = plot(showMacd ? macdAvgTop : na, color=transparentColor, title="MACD Average Top")
fill(macdAvgBotLine, macdAvgTopLine, color=color.new(color.white, 90), title="MACD Average Range")

plot(showMacd ? macd : na,        color=macdColor, linewidth=1, title="MACD")
plot(showMacd ? macdSignal : na,  color=macdColor, linewidth=2, title="MACD Signal")
plot(showMacd ? macdHistory : na, color=macdHistColor, style=plot.style_columns, title="MACD Histogram")

plotshape(showMacd and (macdBot > macdBot[1]) ? macdSignal + (macdAvgBot * 0.25) : na, color=color.green, location=location.absolute, size=size.tiny, style=shape.triangleup,   title="MACD Bullish Divergence")
plotshape(showMacd and (macdTop < macdTop[1]) ? macdSignal + (macdAvgTop * 0.25) : na, color=color.red,   location=location.absolute, size=size.tiny, style=shape.triangledown, title="MACD Bearish Divergence")

if showMacd and (macdBot > macdBot[1])
    strategy.entry("Enter Long", strategy.long)
else if showMacd and (macdTop < macdTop[1])
    strategy.entry("Enter Short", strategy.short)
相关推荐