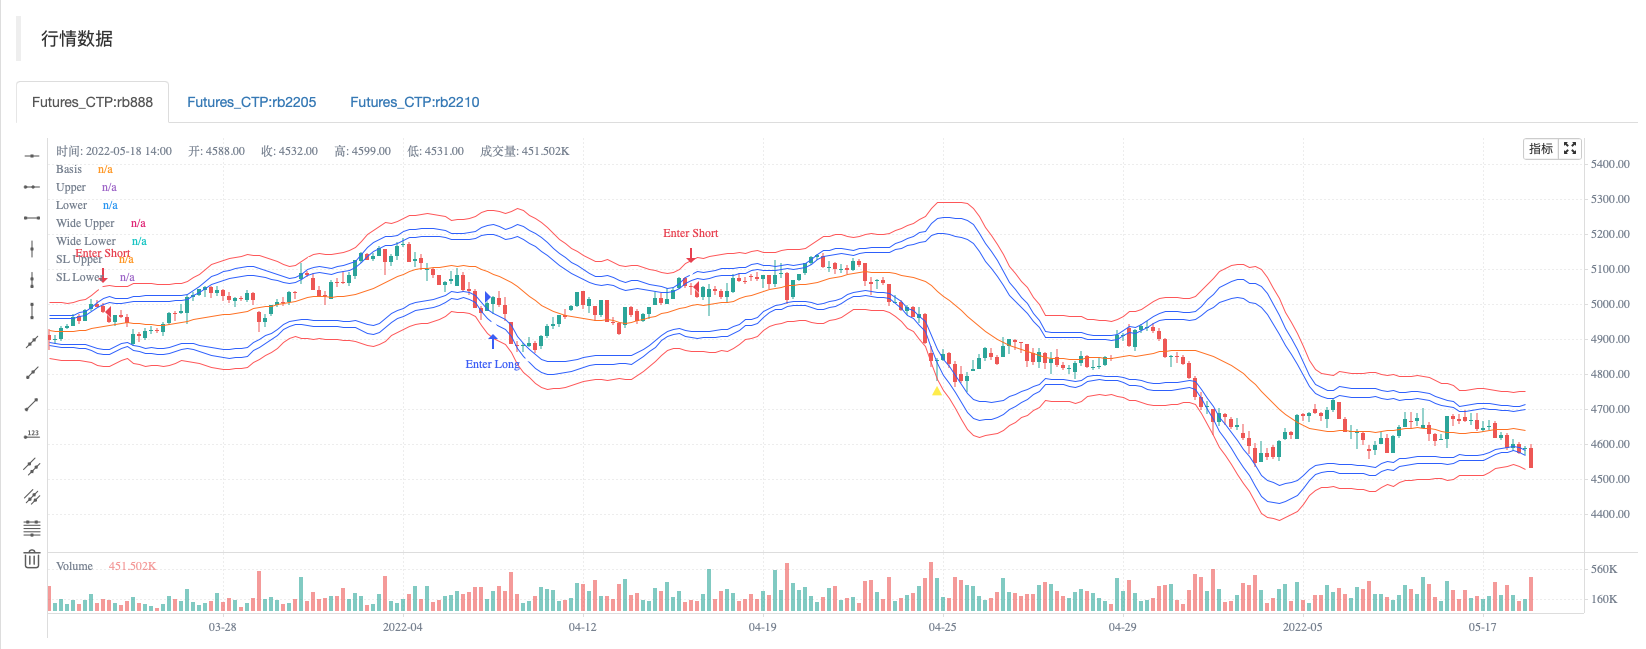
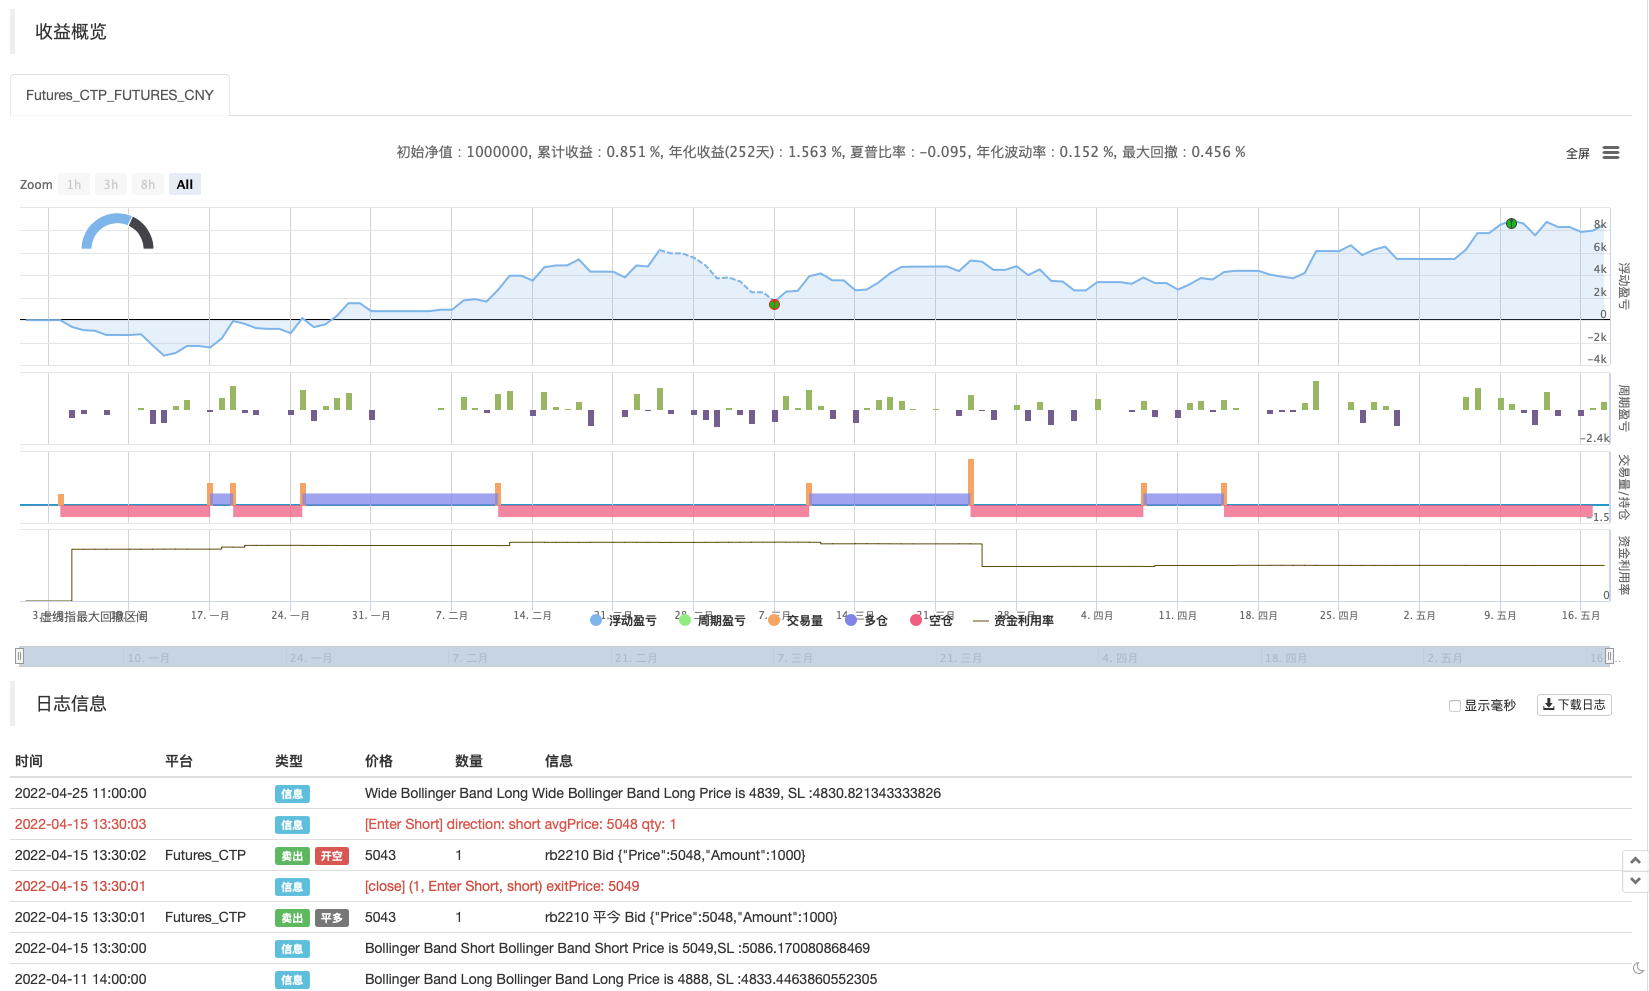
这是一个简单的使用布林带折返的指示器。在蜡烛图上布林带被突破后,折返进入BB的时候是入场点。通常这里会有2个以上的折返,所以你可以等待更好的价格下单。


策略源码
/*backtest
start: 2022-01-01 09:00:00
end: 2022-05-18 15:00:00
period: 1h
basePeriod: 15m
exchanges: [{"eid":"Futures_CTP","currency":"FUTURES"}]
args: [["ContractType","rb888",360008]]
*/


// This source code is subject to the terms of the Mozilla Public License 2.0 at https://mozilla.org/MPL/2.0/
//@SuperJump
//@version=5
indicator(shorttitle="SuperJump TBBB", title="SuperJump Turn Back Bollinger Band", overlay=true, timeframe="", timeframe_gaps=true)
length = input.int(20, title="周期", minval=1, group="布林带", inline='1')
src = input(open, title="数据源", group="布林带", inline='1')
mult = input.float(2.0, minval=0.001, maxval=50, title="标准差", group="布林带", inline='1')
b_mult = input.float(2.5, minval=0.001, maxval=50, title="宽标准差", group="布林带", inline='1')


basis = ta.sma(src, length)

dev = mult * ta.stdev(src, length)
upper = basis + dev
lower = basis - dev

b_dev = b_mult * ta.stdev(src, length)
b_upper = basis + b_dev
b_lower = basis - b_dev


atrlength = input.int(title="ATR周期", defval=14, minval=1,group="ATR" ,inline='2')
smoothing = input.string(title="平滑", defval="RMA", options=["RMA", "SMA", "EMA", "WMA"],group="ATR", inline='2')
SLAtr = input.float(title="止损ATR系数", defval=1.0, minval=1,group="ATR" ,inline='2')
ma_function(source, length) =>
	switch smoothing
		"RMA" => ta.rma(source, length)
		"SMA" => ta.sma(source, length)
		"EMA" => ta.ema(source, length)
		=> ta.wma(source, length)

atr = ma_function(ta.tr(true), atrlength)


LongSig = ta.crossunder(lower,src) and close > open
ShortSig = ta.crossover(upper,src) and close < open
WLongSig = ta.crossunder(b_lower,src) and close > open
WShortSig = ta.crossover(b_upper,src) and close < open


//Plots

plot(basis, "Basis", color=#FF6D00)
plot(upper, "Upper", color=#2962FF)
plot(lower, "Lower", color=#2962FF)
plot(b_upper, "Wide Upper", color=#2962FF)
plot(b_lower, "Wide Lower", color=#2962FF)

plot(b_upper + atr*SLAtr, "SL Upper", color=color.red)
plot(b_lower - atr*SLAtr, "SL Lower", color=color.red)


plotchar(ShortSig and WShortSig == false ? src : na, location = location.abovebar, char= "▼", size = size.tiny, color = color.white )
plotchar(LongSig and WLongSig == false ? src : na, location = location.belowbar, char= "▲", size = size.tiny, color = color.white)

plotchar(WShortSig ? src : na, location = location.abovebar, char= "▼", size = size.tiny, color = color.yellow )
plotchar(WLongSig ? src : na, location = location.belowbar, char= "▲", size = size.tiny, color = color.yellow)


alertcondition(LongSig and WLongSig == false, title='Bollinger Band Long', message='Bollinger Band Long Price is {{close}}, SL :{{plot_4}}')
alertcondition(ShortSig and WShortSig == false, title='Bollinger Band Short', message='Bollinger Band Short Price is {{close}},SL :{{plot_3}} ')
alertcondition(WLongSig, title='Wide Bollinger Band Long', message='Wide Bollinger Band Long Price is {{close}}, SL :{{plot_4}}')
alertcondition(WShortSig, title='Wide Bollinger Band Short', message='Wide Bollinger Band Short Price is {{close}},SL :{{plot_3}} ')


if LongSig
    strategy.entry("Enter Long", strategy.long)
else if ShortSig
    strategy.entry("Enter Short", strategy.short)
相关推荐