动量柱(Mo_Bars)提供了一种不同的方式来可视化(相对)动量,并使用一些简单的TA概念来提供一种不同的视角来理解动量变化,并将其纳入我们的交易中。
这里的想法(以及脚本本身)非常简单,并且(非常松散地)受到了埃尔德的冲动系统(EIS)的启发,然后演变为利用其他一些概念,并变得不那么混乱和“易于阅读”。
Mo_Bars的结构
基本概念利用了3条移动平均线: 第一条线是相对快速的MA,长度较短,作为主要的价格跟踪线
第二条线略慢于主线-长度长2至3条-默认情况下将使用开盘值作为来源-这可以更好地识别收盘价何时开始比开盘价移动更快(如中所示,收盘价比开盘价更频繁)-这条线充当信号线-有一个额外的延迟设置,利用常规WMA平滑-延迟会放大2 mA之间的相对位移
对于这两种MA,我选择使用RSS MA(懒线)-可以使用其他MA类型,但我使用该MA类型的具体原因是它移动“优雅”-两条懒线一起移动可以最大限度地减少价格波动带来的冲击-我用其他MA类型进行了测试,发现RSS在这方面有优势。
第三条线是较慢的MA(长度为快线的5到6倍),用作过滤器或基线。当我们在这条线以上时,我们应该选择多头仓位——我们处于多头区域。当我们在这条线以下时,我们倾向于空头头寸,我们处于熊市区域。调整这条线,因为它适合你的交易风格和时间框架。 (我选择使用WMA作为过滤线的MA类型..这有一个很好的理由-我现在跳过-但在未来的版本中,我们可以添加其他可选的MA类型。)
使用Mo_Bars
在非常广泛的层面上,我们可以使用类似于MACD的Mo_Bars-两者都是居中和非限制振荡器-请注意,Mo_Bars基于3 MA而不是2 MA。
Mo_Bars长度反映主MA和信号MA之间的距离-相对于基线(过滤线)绘制-这意味着条的长度代表2 MA之间的相对动量-然后Mo_Bars以反映动量值增加或减少的方式着色(这里的视觉效果可能是受到我们一位受人尊敬的巫师最近发布的另一个指标的启发-它工作得很好-因此,这里有足够的积分:)
–简单来说,如果主MA低于信号MA,则条形图为红色-当主MA高于信号MA时,条形图为绿色-当检测到相对动量方向的变化时,通常会显示白色条形图(请注意,这与趋势方向不同-这有助于显示和利用收敛和发散-类似于MACD)
在上面的图表中,我注意到了几个例子,说明了以这种方式可视化相对动量如何暴露出切变区域(Mo_Bars高于零,但呈红色或向下移动,或当Mo_Bars低于零,呈绿色或向上移动)-与价格的趋同/分歧-以及这如何暴露价格行动或趋势中潜在变化的可能性。
这个设置还有很多值得玩转的地方——如果有足够的兴趣,将来可能会有专门的帖子介绍如何利用它,甚至进一步发展它——这里有很大的潜力,可以添加更多的过滤器(可能基于卷)、警报、信号。。。等等,让我们看看兴趣:)
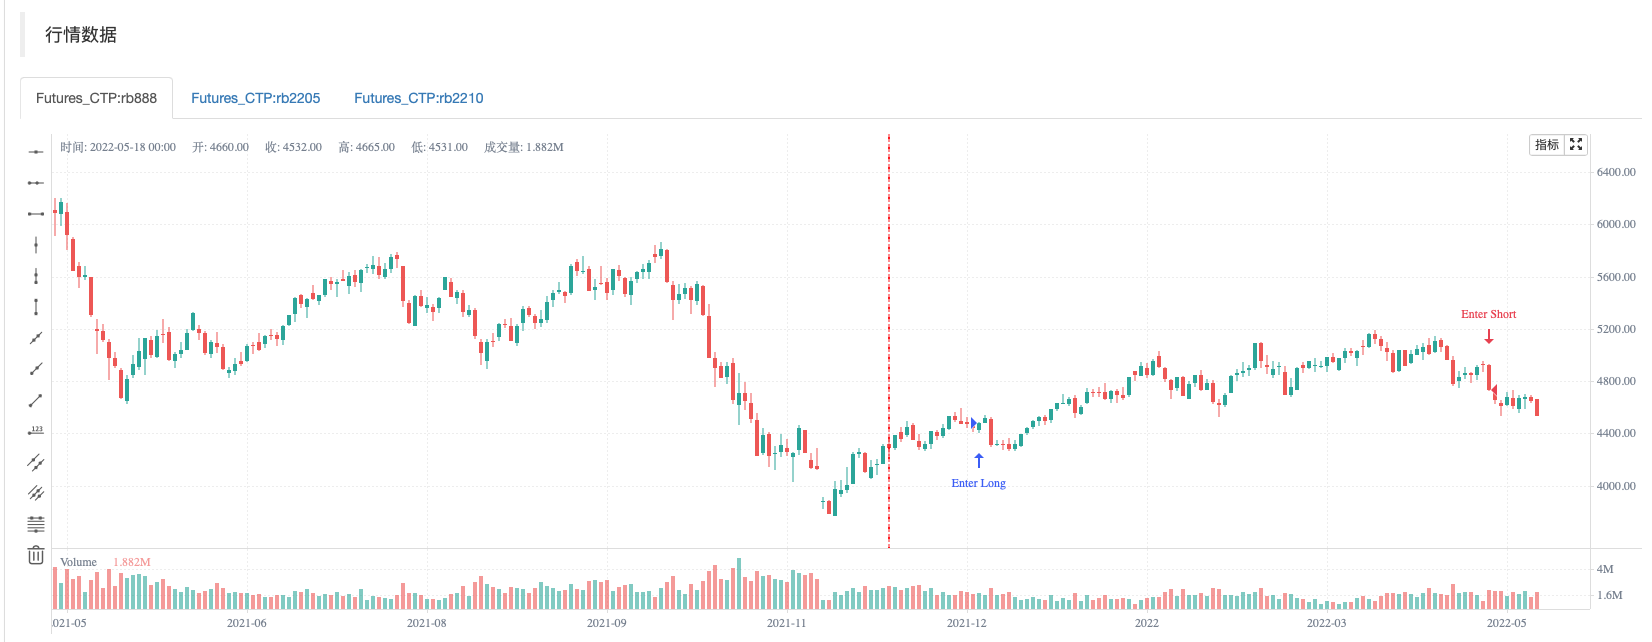
以下是Mo_Bars所基于的详细(顶部图表)设置——价格图上的MA设置已与下部面板上的Mo_Bars设置匹配/同步,以演示脚本如何工作,以及它如何将价格图上的MA操作转换为下面的内容。
/*backtest
start: 2021-12-01 09:00:00
end: 2022-05-18 15:00:00
period: 1d
basePeriod: 1h
exchanges: [{"eid":"Futures_CTP","currency":"FUTURES"}]
args: [["ContractType","rb888",360008]]
*/
// This source code is subject to the terms of the Mozilla Public License 2.0 at https://mozilla.org/MPL/2.0/
// © RedKTrader
//@version=5
indicator('[dev]RedK Momentum Bars', shorttitle='RedK MoBars v3.0', explicit_plot_zorder = true, timeframe='', timeframe_gaps=false)
// A trading system composed of 2 short Lazy Lines (preferably one open and one close - 2-3 bars apart) and a WMA long filter
// loosely inspired by Edler Impulse
// v2.0 cleaned up code and added MA options to be able to mix and match, and experiment with various setups
// default values (my personal preference) remain the same as in v1.0
// for example, some traders will consider "bear territory" only below SMA50, others will use EMA30 .. and so on.
// ---------------------------------------------------------------------------------------------------------------
// MoBars v3.0:
// updated defaults to match the most common 3x MA cross-over set-up of SMA (10, 20, 50)
// updated visuals to push the 0 line to the background of the plot (using the explcit_plot_zorder param)
// and added alerts for crossing up, down and swing around the 0 line (the Bullish/Bearish Filter MA)
//==============================================================================
f_LazyLine(_data, _length) =>
w1 = 0, w2 = 0, w3 = 0
L1 = 0.0, L2 = 0.0, L3 = 0.0
w = _length / 3
if _length > 2
w2 := math.round(w)
w1 := math.round((_length - w2) / 2)
w3 := int((_length - w2) / 2)
L1 := ta.wma(_data, w1)
L2 := ta.wma(L1, w2)
L3 := ta.wma(L2, w3)
else
L3 := _data
L3
//==============================================================================
// =============================================================================
f_getMA(source, length, type) =>
type == "SMA" ? ta.sma(source, length) :
type == "EMA" ? ta.ema(source, length) :
type == "WMA" ? ta.wma(source, length) :
type == "HMA" ? ta.hma(source, length) :
f_LazyLine(source, length)
// =============================================================================
// ------------------------------------------------------------------------------------------------
// Inputs
// Note, in v3.0, changed default lengths to 10, 20 and 50 -- and all MA types to SMA.
// ------------------------------------------------------------------------------------------------
Fast_Src = input.source(close, title='MA快线数据源,默认用收盘价序列', inline = 'Fast')
Fast_Length = input.int(10, title = '快线周期', minval = 1, inline = 'Fast')
Fast_Type = input.string('SMA', title = '快线均线类型', inline = 'Fast',
options = ['RSS_WMA', 'WMA', 'EMA', 'SMA', 'HMA'])
Slow_Src = input.source(close, title='MA慢线数据源', inline = 'Slow')
Slow_Length = input.int(20, title='慢线周期', minval = 1, inline = 'Slow')
Slow_Type = input.string('SMA', title = '慢线均线类型', inline = 'Slow',
options = ['RSS_WMA', 'WMA', 'EMA', 'SMA', 'HMA'])
Slow_Delay = input.int(3, title='延迟 (1 = None)', minval = 1)
Fil_Length = input.int(50, title='MA过滤线周期', minval = 1, inline = 'Filter')
Fil_Type = input.string('SMA', title = '过滤均线类型', inline = 'Filter',
options = ['RSS_WMA', 'WMA', 'EMA', 'SMA', 'HMA'])
// ------------------------------------------------------------------------------------------------
// Calculation
// ------------------------------------------------------------------------------------------------
Fast = f_getMA(Fast_Src, Fast_Length, Fast_Type)
Slow = f_getMA(Slow_Src, Slow_Length, Slow_Type)
Filter = f_getMA(close, Fil_Length, Fil_Type)
Fast_M = Fast - Filter
Slow_M = Slow - Filter
Rel_M = ta.wma(Slow_M, Slow_Delay)
// prep the Momentum bars
o = Rel_M
c = Fast_M
h = math.max(o, c)
l = math.min(o, c)
rising = ta.change(c) > 0
// ------------------------------------------------------------------------------------------------
// Colors & Plots
// ------------------------------------------------------------------------------------------------
hline(0, title = 'Zero Line', color = color.blue, linestyle = hline.style_solid)
c_barup = #11ff20ff
c_bardn = #ff1111ff
c_bardj = #ffffffff
c_barupb = #1b5e20ff
c_bardnb = #981919ff
c_bardjb = #9598a1ff
barcolor = c > o and rising ? c_barup : c < o and not rising ? c_bardn : c_bardj
borcolor = c > o and rising ? c_barupb : c < o and not rising ? c_bardnb : c_bardjb
//plotcandle(o, h, l, c, 'MoBars', barcolor, barcolor, bordercolor = borcolor)
// ===========================================================================================================
// v3.0 adding alerts
// these alerts will trigger as soon as the Momentum Bar touches above the filter line
// this approach can lead to "false signals" but also has an advantage (of alerting to a possible mood/mode change)
// another option - maybe in an updated version - could be to trigger alerts *only* when the full Momentum Bar completely clears the filter line (above or below)
// and it's easy to make that a user choice in the study inputs
// ===========================================================================================================
Alert_up = ta.crossover(h,0)
Alert_dn = ta.crossunder(l,0)
Alert_swing = Alert_up or Alert_dn
// "." in alert title for the alerts to show in the right order up/down/swing
alertcondition(Alert_up, ". MoBars Crossing 0 Up", "MoBars Up - Bullish Mode Detected!")
alertcondition(Alert_dn, ".. MoBars Crossing 0 Down", "MoBars Down - Bearish Mode Detected!")
alertcondition(Alert_swing, "... MoBars Crossing 0", "Mobars Swing - Possible Reversal Detected!")
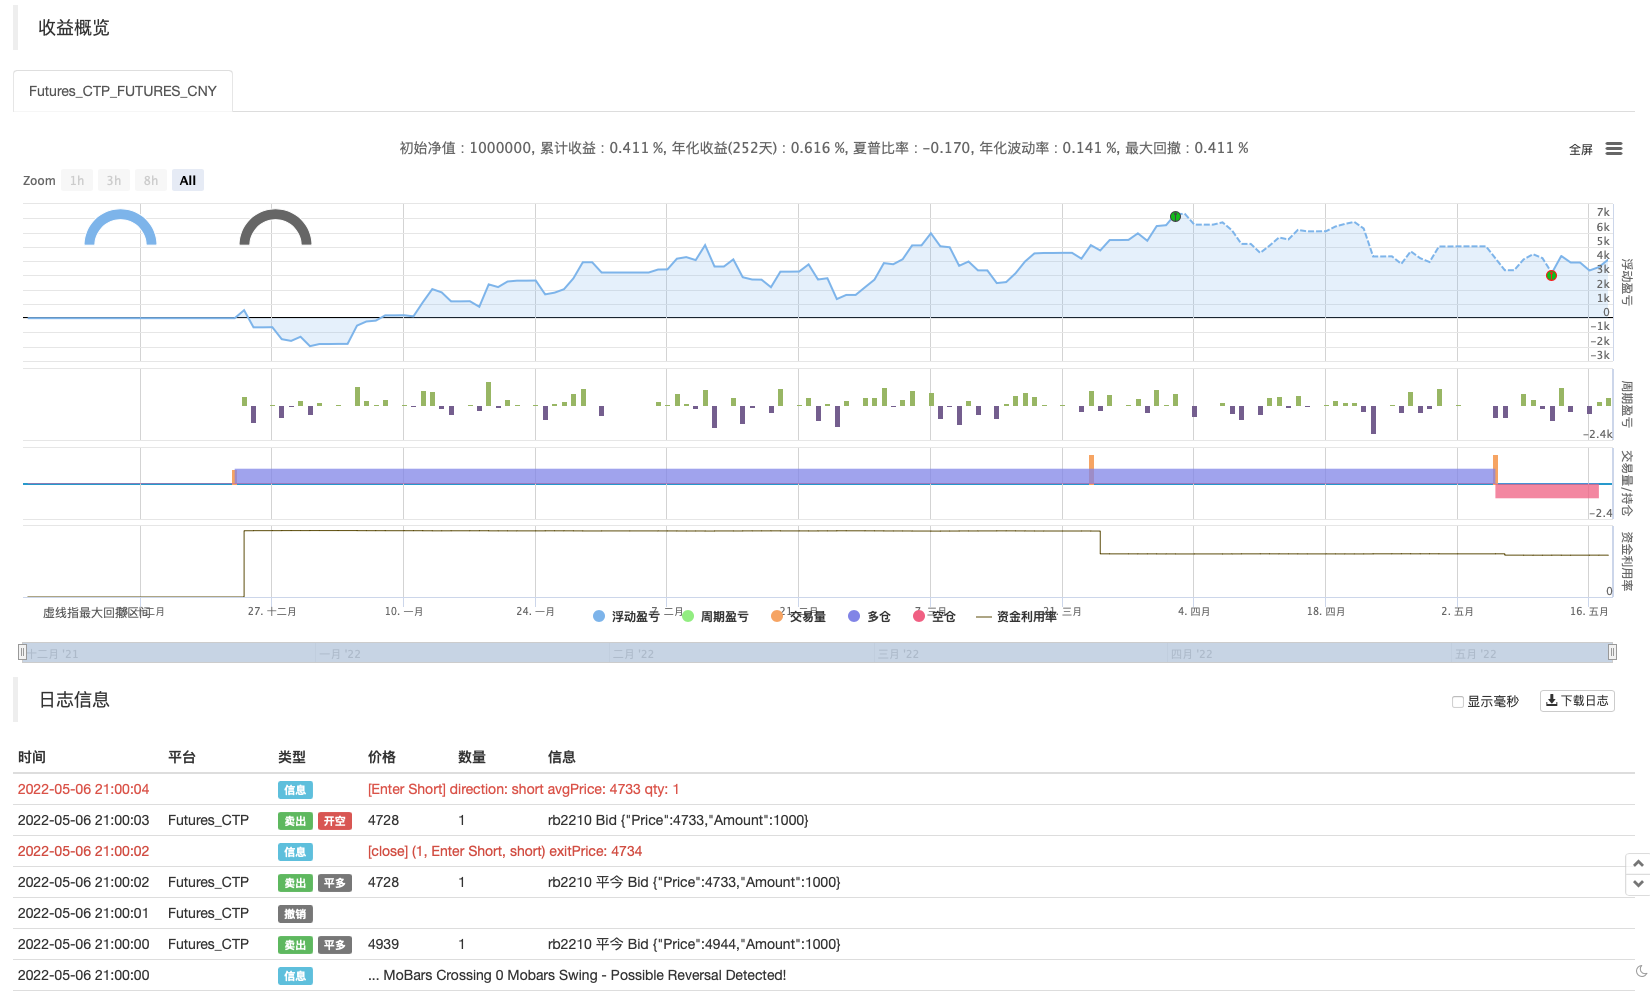
if Alert_up
strategy.entry("Enter Long", strategy.long)
else if Alert_dn
strategy.entry("Enter Short", strategy.short)