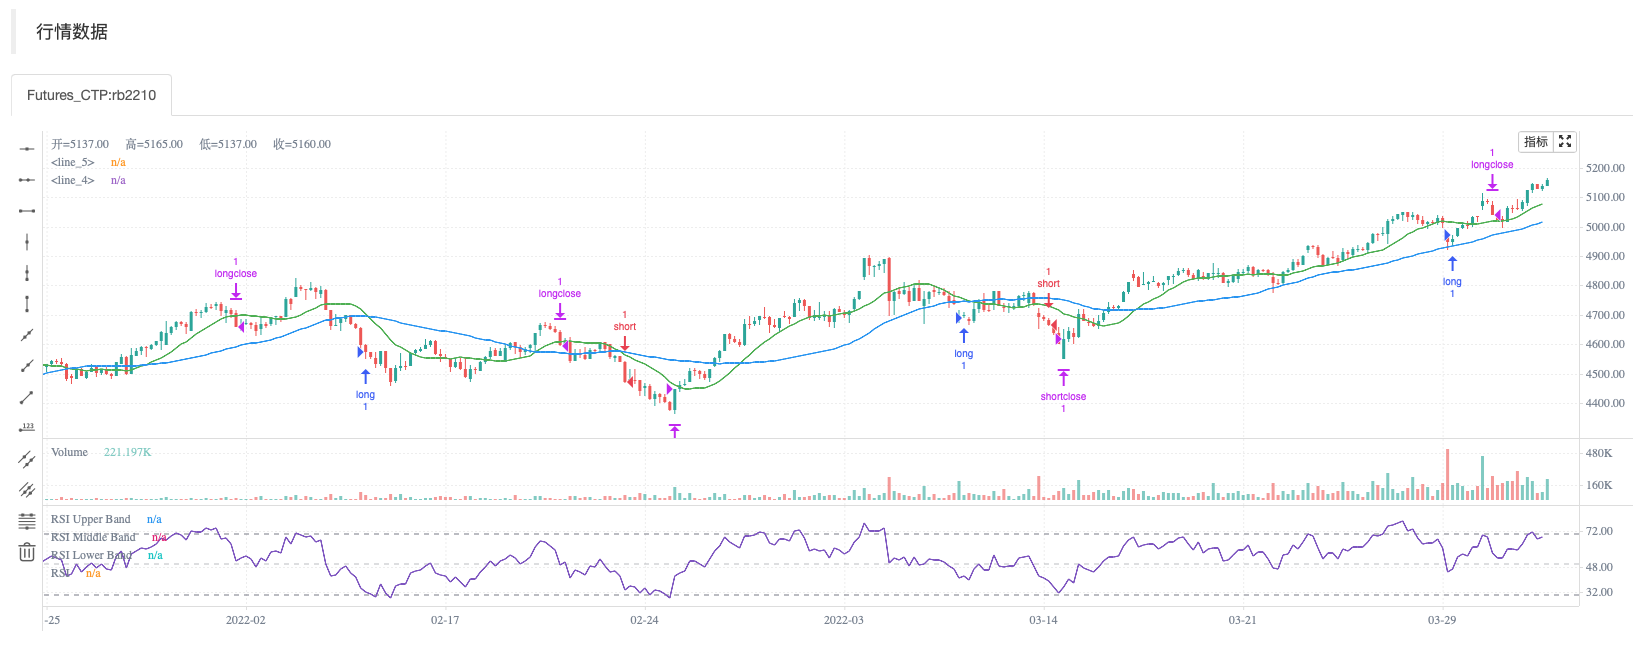
策略完全基于动量、数量和价格。我们使用了:
- 1: 布林带,以了解何时可能发生突破。
- 2: 使用移动平均线(SMA和EMA)来了解方向。
- 3: 该策略的成功率在75%以上,如果加上很少的价格动作,很容易超过90%的成功率。
- 4: 不要担心回撤,我们已经实现了跟踪止损,所以您可能会看到一点额外的回撤,但实际上很少。
- 5: 我自己用一个250美元的账户测试了41天,现在我有2700美元。
策略仅供参考、学习。
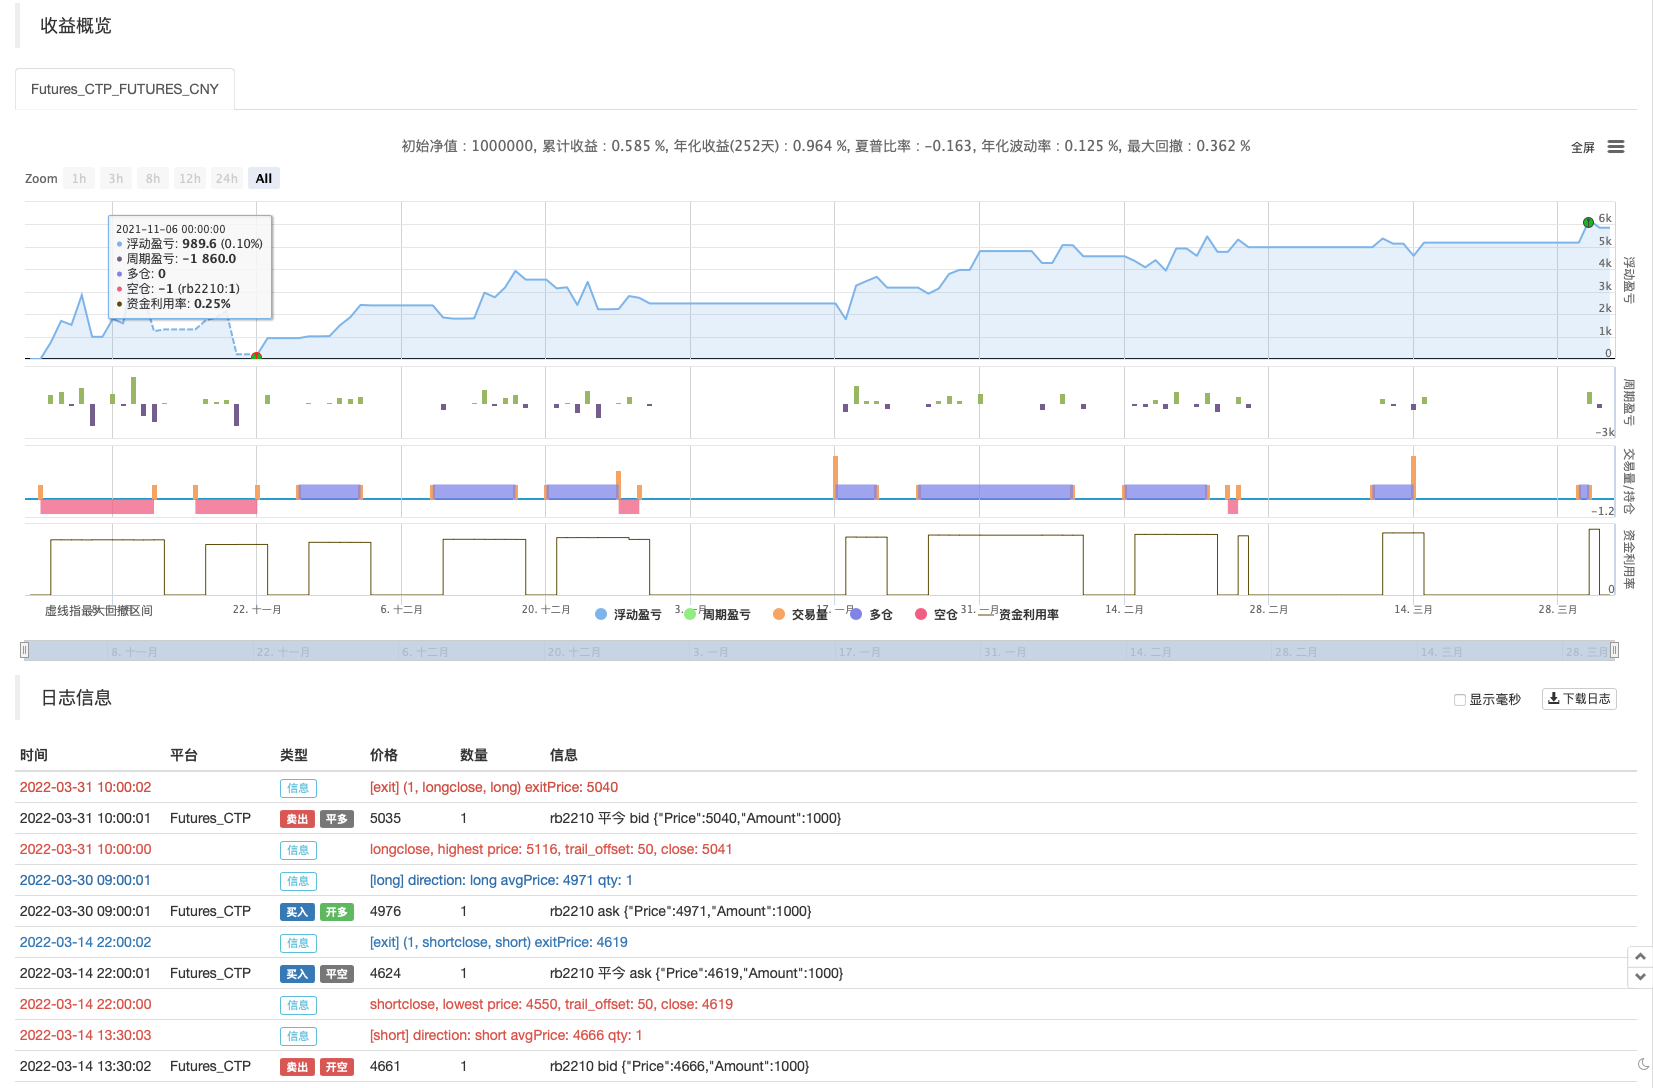
回测测试


策略源码
/*backtest
start: 2021-11-01 00:00:00
end: 2022-04-03 00:00:00
period: 1h
basePeriod: 15m
exchanges: [{"eid":"Futures_CTP","currency":"FUTURES"}]
args: [["ContractType","rb2210",360008]]
*/

// This source code is subject to the terms of the Mozilla Public License 2.0 at https://mozilla.org/MPL/2.0/
// © The_Bigger_Bull
//@version=5
strategy("Best TradingView Strategy", overlay=true, margin_long=0, margin_short=0)
//Bollinger Bands
source1 = close
length1 = input.int(15, minval=1, title="周期")
mult1 = input.float(2.0, minval=0.001, maxval=50, title="乘数")
basis1 = ta.sma(source1, length1)
dev1 = mult1 * ta.stdev(source1, length1)
upper1 = basis1 + dev1
lower1 = basis1 - dev1
//buyEntry = ta.crossover(source1, lower1)
//sellEntry = ta.crossunder(source1, upper1)

//RSI
ma(source, length, type) =>
    switch type
        "SMA" => ta.sma(source, length)
        "Bollinger Bands" => ta.sma(source, length)
        "EMA" => ta.ema(source, length)
        "SMMA (RMA)" => ta.rma(source, length)
        "WMA" => ta.wma(source, length)
        "VWMA" => ta.vwma(source, length)

rsiLengthInput = input.int(14, minval=1, title="RSI 周期", group="RSI Settings")
rsiSourceInput = input.source(close, "数据源", group="RSI Settings")
maTypeInput = input.string("SMA", title="均线类型", options=["SMA", "Bollinger Bands", "EMA", "SMMA (RMA)", "WMA", "VWMA"], group="MA Settings")
maLengthInput = input.int(14, title="均线周期", group="MA Settings")
bbMultInput = input.float(2.0, minval=0.001, maxval=50, title="BB 标准差", group="MA Settings")

up = ta.rma(math.max(ta.change(rsiSourceInput), 0), rsiLengthInput)
down = ta.rma(-math.min(ta.change(rsiSourceInput), 0), rsiLengthInput)
rsi = down == 0 ? 100 : up == 0 ? 0 : 100 - (100 / (1 + up / down))
rsiMA = ma(rsi, maLengthInput, maTypeInput)
isBB = maTypeInput == "Bollinger Bands"

plot(rsi, "RSI", color=#7E57C2, overlay=false)
//plot(rsiMA, "RSI-based MA", color=color.yellow)
rsiUpperBand = hline(70, "RSI Upper Band", color=#787B86, overlay=false)
hline(50, "RSI Middle Band", color=color.new(#787B86, 50), overlay=false)
rsiLowerBand = hline(30, "RSI Lower Band", color=#787B86, overlay=false)
//fill(rsiUpperBand, rsiLowerBand, color=color.rgb(126, 87, 194, 90), title="RSI Background Fill")
bbUpperBand = plot(isBB ? rsiMA + ta.stdev(rsi, maLengthInput) * bbMultInput : na, title = "Upper Bollinger Band", color=color.green)
bbLowerBand = plot(isBB ? rsiMA - ta.stdev(rsi, maLengthInput) * bbMultInput : na, title = "Lower Bollinger Band", color=color.green)
//fill(bbUpperBand, bbLowerBand, color= isBB ? color.new(color.green, 90) : na, title="Bollinger Bands Background Fill")

//ADX

adxlen = input(14, title="ADX 平滑")
dilen = input(14, title="DI 周期")
dirmov(len) =>
	up1 = ta.change(high)
	down1 = -ta.change(low)
	plusDM = na(up1) ? na : (up1 > down1 and up1 > 0 ? up1 : 0)
	minusDM = na(down1) ? na : (down1 > up1 and down1 > 0 ? down1 : 0)
	truerange = ta.rma(ta.tr, len)
	plus = fixnan(100 * ta.rma(plusDM, len) / truerange)
	minus = fixnan(100 * ta.rma(minusDM, len) / truerange)
	[plus, minus]
adx(dilen, adxlen) =>
	[plus, minus] = dirmov(dilen)
	sum = plus + minus
	adx = 100 * ta.rma(math.abs(plus - minus) / (sum == 0 ? 1 : sum), adxlen)
sig = adx(dilen, adxlen)


out = ta.sma(close, 14)

sma1=ta.sma(close,42)

ema200=ta.ema(close,200)


longCondition = (out>sma1) and ta.crossover(source1, lower1)

if (longCondition )
    strategy.entry("long", strategy.long)

shortCondition = (out<sma1) and ta.crossunder(source1, lower1)

if (shortCondition )
    strategy.entry("short", strategy.short)


stopl=strategy.position_avg_price-50
tptgt=strategy.position_avg_price+100
stopshort=strategy.position_avg_price+50
tptgtshort=strategy.position_avg_price-100

strategy.exit("longclose","long",trail_offset=50,trail_points=100,when=ta.crossover(sma1,out))
strategy.exit("shortclose","short",trail_offset=50,trail_points=100,when=ta.crossover(out,sma1))


//if strategy.position_avg_price<0


plot(sma1 , color=color.blue)
plot(out, color=color.green)
//plot(ema200,color=color.red)
相关推荐
- RSI-买卖信号策略
- K的反转指示器I
- VuManChu密码B + 差异策略
- EMA和ADX的三倍超趋势策略
- 彩色的移动平均指标EMA/SMA
- BB-RSI-ADX指标入场点策略
- SMA指标杀手策略
- 大鲷鱼警报R3.0+柴金波动条件+TP RSI
- Saudaldhaidy策略
- CCI+EMA与RSI交叉策略
更多内容