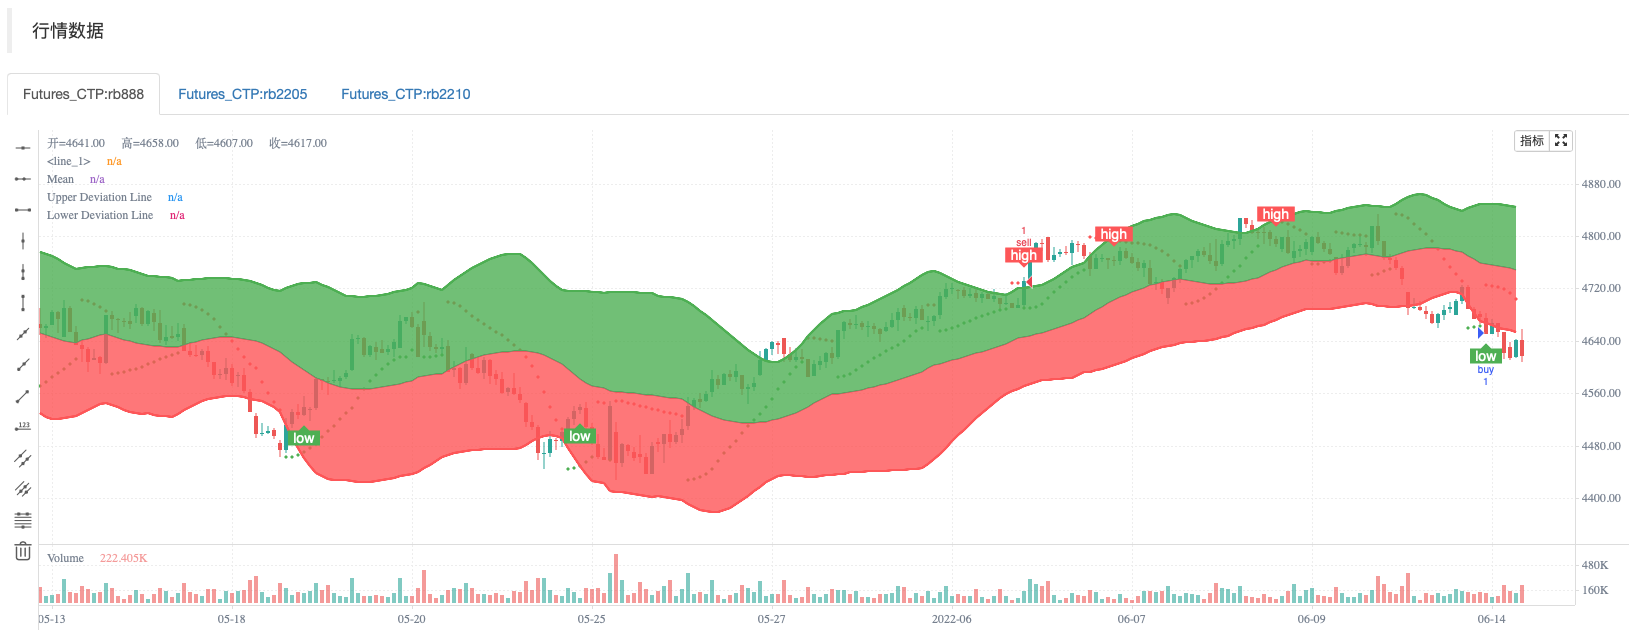
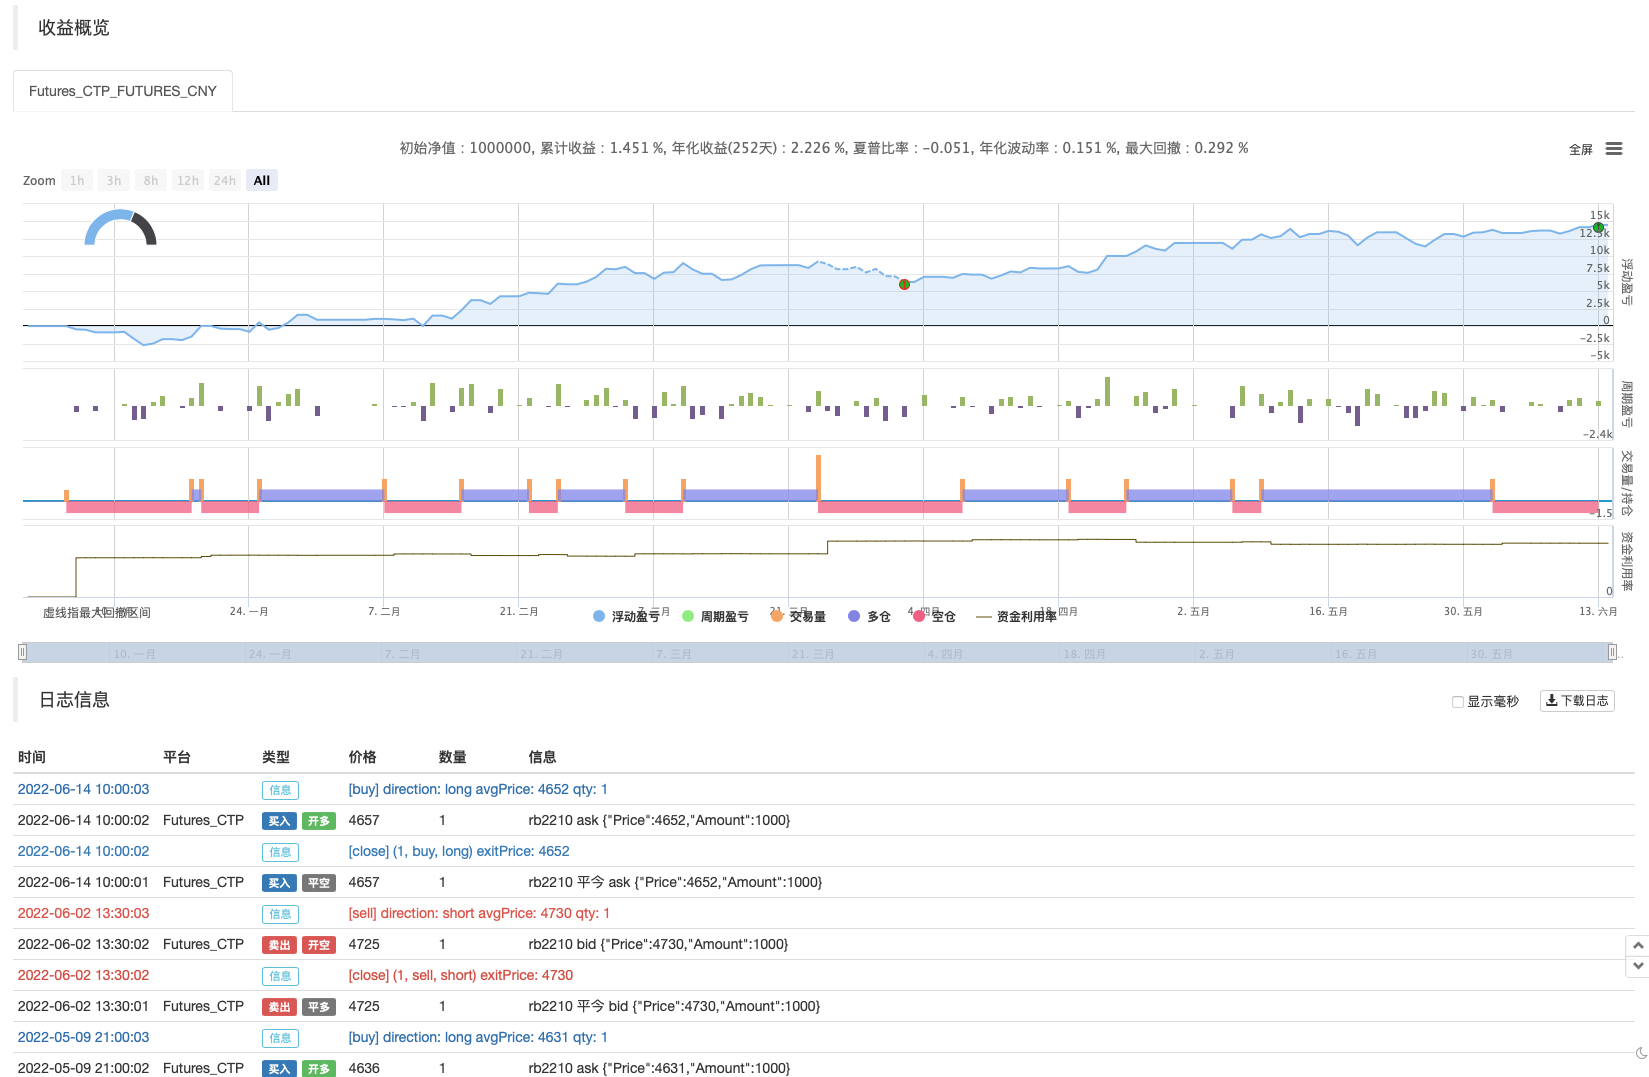
策略回测


策略源码
/*backtest
start: 2022-01-01 09:00:00
end: 2022-06-14 15:00:00
period: 30m
basePeriod: 15m
exchanges: [{"eid":"Futures_CTP","currency":"FUTURES"}]
args: [["ContractType","rb888",360008]]
*/

//@version=4
study("SAR -high and low",overlay = true)
// INPUTS //
//
start = input(0.02, title="起始")
increment = input(0.02, title="增量")
maximum = input(0.2, title="最大值")
s1 = sar(start, increment, maximum)
pc = close < s1 ? color.red : color.green
plot(s1, style=plot.style_cross, color=pc)
//


lookBack = input(40, title="回看周期")
//
multi = input(2, title="乘数", minval=0.001, maxval=2)

mean = ema(s1 ,lookBack)
stddev = multi * stdev(s1, lookBack)
b = mean + stddev
s2 = mean - stddev

low1 = crossover(s1, s2)
high1 = crossunder(s1, b)

meanp = plot(mean, title="Mean", color=color.gray)
bsign = plot(b, title="Upper Deviation Line", color=color.green, linewidth=2)
ssign = plot(s2, title="Lower Deviation Line", color=color.red, linewidth=2)

fill(bsign, meanp, title="Upper Deviation fill", color=color.green)
fill(meanp, ssign, title="Lower Deviation fill", color=color.red)


plotshape(low1, title="low", text="low", color=color.green, style=shape.labelup, location=location.belowbar, size=size.small, textcolor=color.white, transp=0)  //plot for buy icon
plotshape(high1, title="high", text="high", color=color.red, style=shape.labeldown, location=location.abovebar, size=size.small, textcolor=color.white, transp=0)  //plot for sell icon
if low1
   strategy.entry("buy", strategy.long)
else if high1
    strategy.entry("sell", strategy.short)
相关推荐