Overview
This advanced automated trading strategy is a comprehensive trading system that integrates multiple technical analysis methods, combining moving averages, volume analysis, candlestick patterns, and support-resistance analysis to identify potential trading opportunities. The strategy employs a systematic approach to market analysis by establishing clear entry and exit conditions while incorporating risk management mechanisms. It primarily bases trading decisions on price momentum, market volatility, and volume changes to determine optimal trading timing, using support and resistance levels as key reference points, with the aim of capturing profitable trading opportunities at market trends and reversal points.
Strategy Principles
The core principles of this strategy are based on multi-dimensional technical indicator analysis, specifically including:
Moving Average as Trend Indicator: Uses a 20-period Simple Moving Average (SMA) as a baseline reference for medium-term trends. The price position relative to the moving average helps determine the overall market direction.
Volume Confirmation Signals: The strategy identifies volume anomalies by comparing current volume to the average volume over the past 10 periods. When volume exceeds 150% of the average level, it’s considered a volume breakout, typically indicating enhanced price momentum.
Candlestick Pattern Analysis:
- Large Range Candles: When the candle body (high-low range) exceeds 150% of the average range over the past 10 periods, indicating increased market volatility
- Bullish/Bearish Candles: Determined by the closing price relative to the opening price
Support-Resistance Identification: The strategy allows users to set critical support and resistance levels and calculates the proximity of price to support to find potential bounce points.
Entry Condition Combinations:
- Long Condition: Price near support (user-defined proximity), bullish candle formation, and volume breakout
- Short Condition: Price below moving average, large bearish candle, and volume breakout
Risk Management Mechanism: The strategy integrates stop-loss and take-profit mechanisms, using fixed point settings to limit risk per trade and secure potential profits.
Strategy Advantages
Multi-Dimensional Signal Confirmation: Filters low-quality signals by requiring multiple conditions to be met simultaneously (price position, candle pattern, volume confirmation), reducing false breakout trades.
Flexible Parameterized Design: The strategy offers 12 adjustable parameters, enabling traders to customize settings based on different market conditions and trading styles.
Integrated Risk Management: Automated stop-loss and take-profit mechanisms ensure each trade has a predefined risk-reward ratio, avoiding emotional decision-making.
Synergy of Technical Indicators: The strategy doesn’t rely on a single indicator but combines trend, momentum, volume, and price action analysis, providing a more comprehensive market perspective.
Visual Assistance: The strategy includes visualization components such as support-resistance display, moving average plotting, and entry signal marking, helping traders intuitively understand market conditions and strategy logic.
Targeted Trading Rules: The strategy designs differentiated entry rules for different market conditions, with long strategies focusing on support level bounces and short strategies focusing on trend continuation signals.
Strategy Risks
Fixed Parameter Risk: The strategy uses fixed support and resistance level settings. In volatile markets, these static levels may quickly become outdated, leading to erroneous signals. Solution: Implement dynamic support-resistance calculations or manually update these parameters regularly based on market structure changes.
Excessive Reliance on Volume: Volume patterns in certain markets or time periods may be unstable, leading to misleading signals. Solution: Consider adding volume filtering conditions or integrating other confirmation indicators to reduce dependence on single volume breakouts.
Market Environment Disregard: The strategy doesn’t differentiate between trending and ranging markets, potentially generating excessive trading signals in unsuitable market conditions. Solution: Add market environment filters, such as volatility indicators or trend strength measurements, to adjust strategy parameters in different market environments.
Fixed Stop-Loss Strategy: Using fixed point stop-losses may be insufficient during high volatility periods and excessive during low volatility periods. Solution: Implement volatility-based adaptive stop-losses, such as ATR (Average True Range) based stop-loss settings.
Lack of Time Filtering: The strategy may generate signals at any time, including market opening and closing sessions where low liquidity or high volatility may exist. Solution: Add time filtering conditions to avoid trading during specific market sessions.
Strategy Optimization Directions
Adaptive Parameter Settings: Convert fixed period parameters (such as moving average periods, volume and range lookback periods) to adaptive parameters based on market volatility. Reason: Different market environments require different sensitivity settings; adaptive parameters can maintain strategy performance stability across various market conditions.
Multi-Timeframe Analysis: Integrate confirmation signals from higher timeframes to ensure trade direction aligns with larger trends. Reason: Trades counter to the main trend typically carry higher risk; multi-timeframe analysis can improve the strategy’s win rate.
Improved Support-Resistance Identification: Implement algorithmic support-resistance level detection rather than relying on fixed levels. Reason: Dynamically identified support and resistance levels more accurately reflect current market structure, adapting to market evolution.
Integration of More Candlestick Patterns: Add recognition of more complex patterns beyond simple bullish/bearish candles, such as engulfing patterns, hammers, or morning stars. Reason: Specific candlestick patterns can provide more precise reversal or continuation signals, improving entry timing quality.
Risk Management Enhancement: Implement volatility-based stop-losses and partial profit-taking mechanisms. Reason: Adaptive risk management can better accommodate market conditions, improving overall risk-adjusted returns.
Optimized Volume Analysis: Differentiate between up-volume and down-volume to provide more detailed volume confirmation for trades in different directions. Reason: The nature of volume (not just size) provides valuable information about potential market momentum and participant sentiment.
Summary
This advanced automated trading strategy represents a comprehensive technical analysis framework that fuses trend analysis, volume research, price action, and support-resistance dynamics to capture high-probability trading opportunities. By requiring multiple condition confirmations, the strategy can reduce false signals, while the integrated risk management mechanisms help protect capital and secure profits. Although the strategy provides a solid foundation for trading automation, there is room for improvement, particularly in dynamic parameter adjustment, market environment filtering, and support-resistance identification. For technical analysts looking to build robust trading systems, this strategy offers an expandable framework that can be customized and optimized according to specific market conditions and individual risk preferences. Most importantly, the strategy emphasizes the value of an integrated analytical approach, demonstrating how various technical indicators and trading concepts can be incorporated into a coherent trading system.
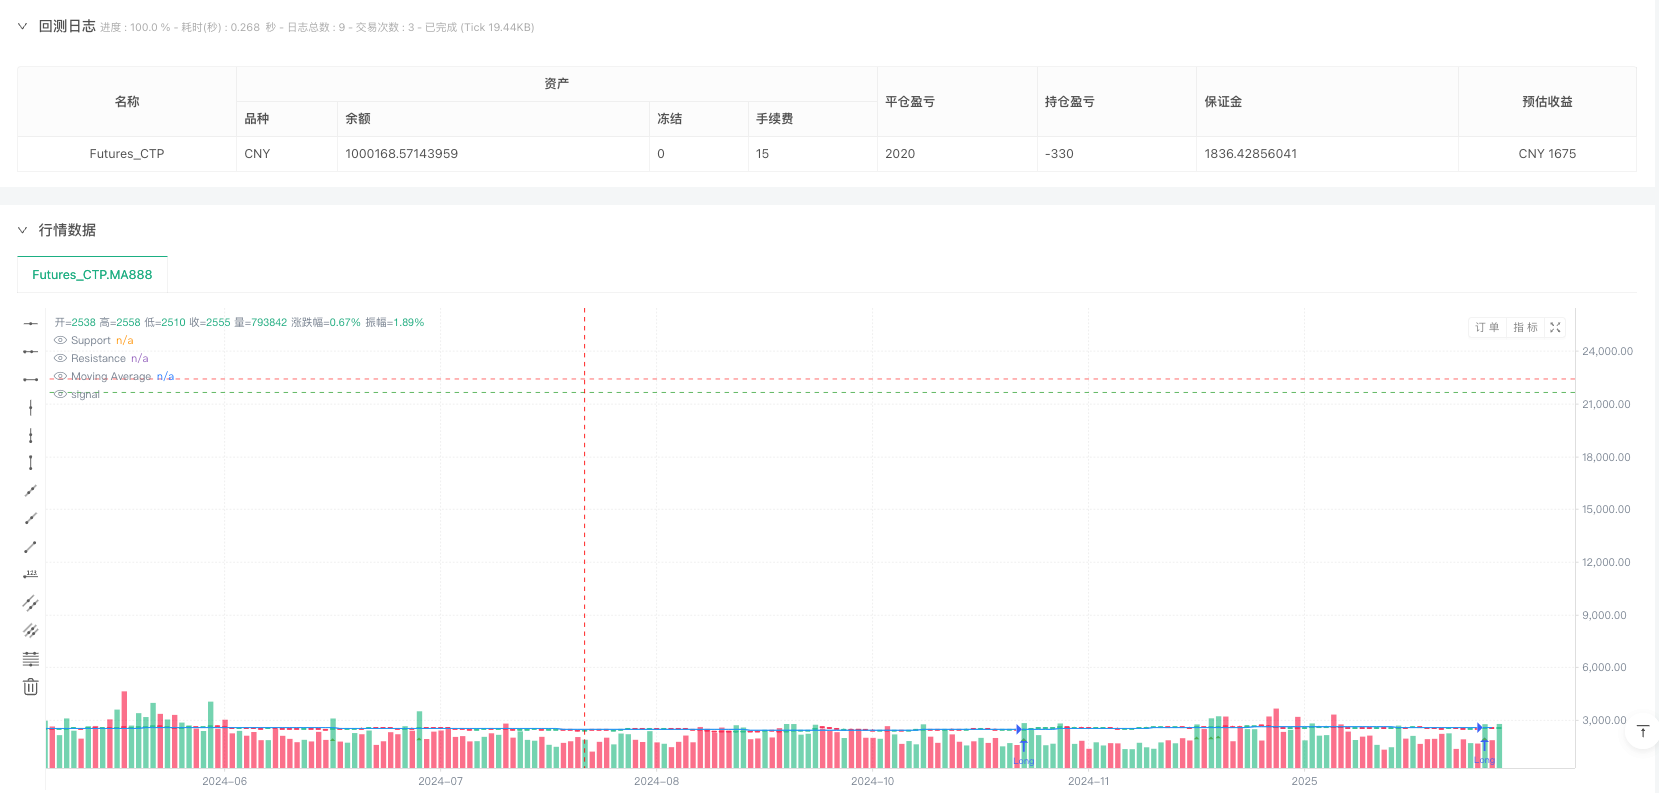
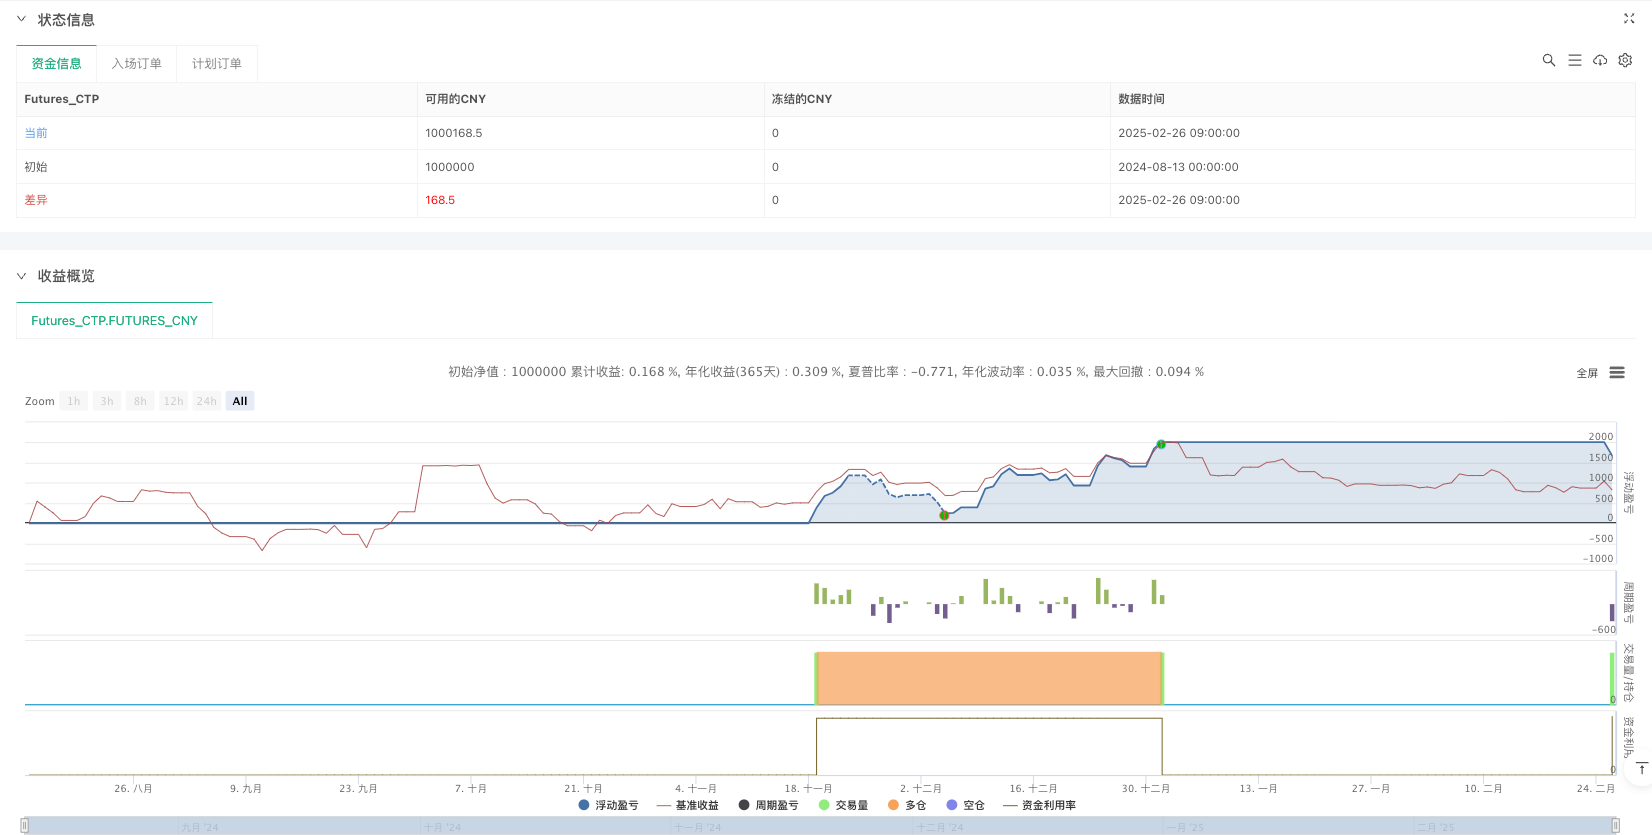
/*backtest
start: 2024-08-13 00:00:00
end: 2025-02-26 15:00:00
period: 1d
basePeriod: 1d
exchanges: [{"eid":"Futures_CTP","currency":"FUTURES"}]
*/

//@version=5
strategy("Auto Trading Strategy", overlay=true)

// Inputs for Customization
maPeriod = input.int(20, "Moving Average Period", minval=1)
supportLevel = input.float(21662.5, "Support Level")
resistanceLevel = input.float(22450, "Resistance Level")
volumeLookback = input.int(10, "Volume Lookback Period", minval=1)
rangeLookback = input.int(10, "Range Lookback Period", minval=1)
proximity = input.float(100, "Proximity to Support (points)", minval=0)
stopLossPoints = input.float(100, "Stop Loss (points)", minval=0)
takeProfitPoints = input.float(200, "Take Profit (points)", minval=0)

// Calculate Indicators
// 20-period Simple Moving Average
ma = ta.sma(close, maPeriod)

// Volume Spike Detection (50% above average)
avgVolume = ta.sma(volume, volumeLookback)
volumeSpike = volume > avgVolume * 1.5

// Large Candle Range Detection (50% larger than average)
candleRange = high - low
avgRange = ta.sma(candleRange, rangeLookback)
largeRange = candleRange > avgRange * 1.5

// Candlestick Definitions
bearishCandle = close < open
bullishCandle = close > open

// Trading Conditions
// Short Entry: Price below MA, large bearish candle, volume spike
shortCondition = close < ma and largeRange and volumeSpike and bearishCandle

// Long Entry: Price near support, bullish candle, volume spike
nearSupport = close <= supportLevel + proximity
longCondition = nearSupport and bullishCandle and volumeSpike

// Execute Trades
if longCondition
    strategy.entry("Long", strategy.long)
if shortCondition
    strategy.entry("Short", strategy.short)

// Exit Trades with Stop-Loss and Take-Profit
strategy.exit("Long Exit", "Long", stop=strategy.position_avg_price - stopLossPoints, limit=strategy.position_avg_price + takeProfitPoints)
strategy.exit("Short Exit", "Short", stop=strategy.position_avg_price + stopLossPoints, limit=strategy.position_avg_price - takeProfitPoints)

// Visualizations
hline(supportLevel, "Support", color=color.green)
hline(resistanceLevel, "Resistance", color=color.red)
plot(ma, "Moving Average", color=color.blue)

// Debug Entry Signals
plotshape(longCondition, title="Long Entry", location=location.belowbar, color=color.green, style=shape.triangleup, size=size.small)
plotshape(shortCondition, title="Short Entry", location=location.abovebar, color=color.red, style=shape.triangledown, size=size.small)