## Overview
This strategy is a quantitative trading system based on the Supertrend indicator, combined with precise risk management mechanisms. The core of the strategy uses the crossover relationship between price and the Supertrend line to determine entry timing, while setting a 1% take profit and 1% stop loss for each trade, achieving precise control of risk and reward. The Supertrend indicator is calculated using the Average True Range (ATR) and a custom factor, effectively identifying market trend changes, helping traders enter at the early stages of trend formation and exit promptly when trends reverse, thereby improving the success rate and stability of trades.
Strategy Principles
The core principles of this strategy are based on the calculation and application of the Supertrend indicator:
Supertrend Indicator Calculation:
- The strategy first calculates the Average True Range (ATR), with a default period of 14
- Multiplies the ATR by a custom factor (default 3.0) to obtain the volatility band width
- Calculates the Supertrend line based on price and volatility band width
Entry Signal Generation:
- Long signal: When price crosses above the Supertrend line (ta.crossover function)
- Short signal: When price crosses below the Supertrend line (ta.crossunder function)
Risk Management Mechanism:
- Long trades: 1% stop loss below entry price, 1% take profit above entry price
- Short trades: 1% stop loss above entry price, 1% take profit below entry price
- Implements automatic stop loss and take profit using the stop and limit parameters of the strategy.entry function
Visual Assistance:
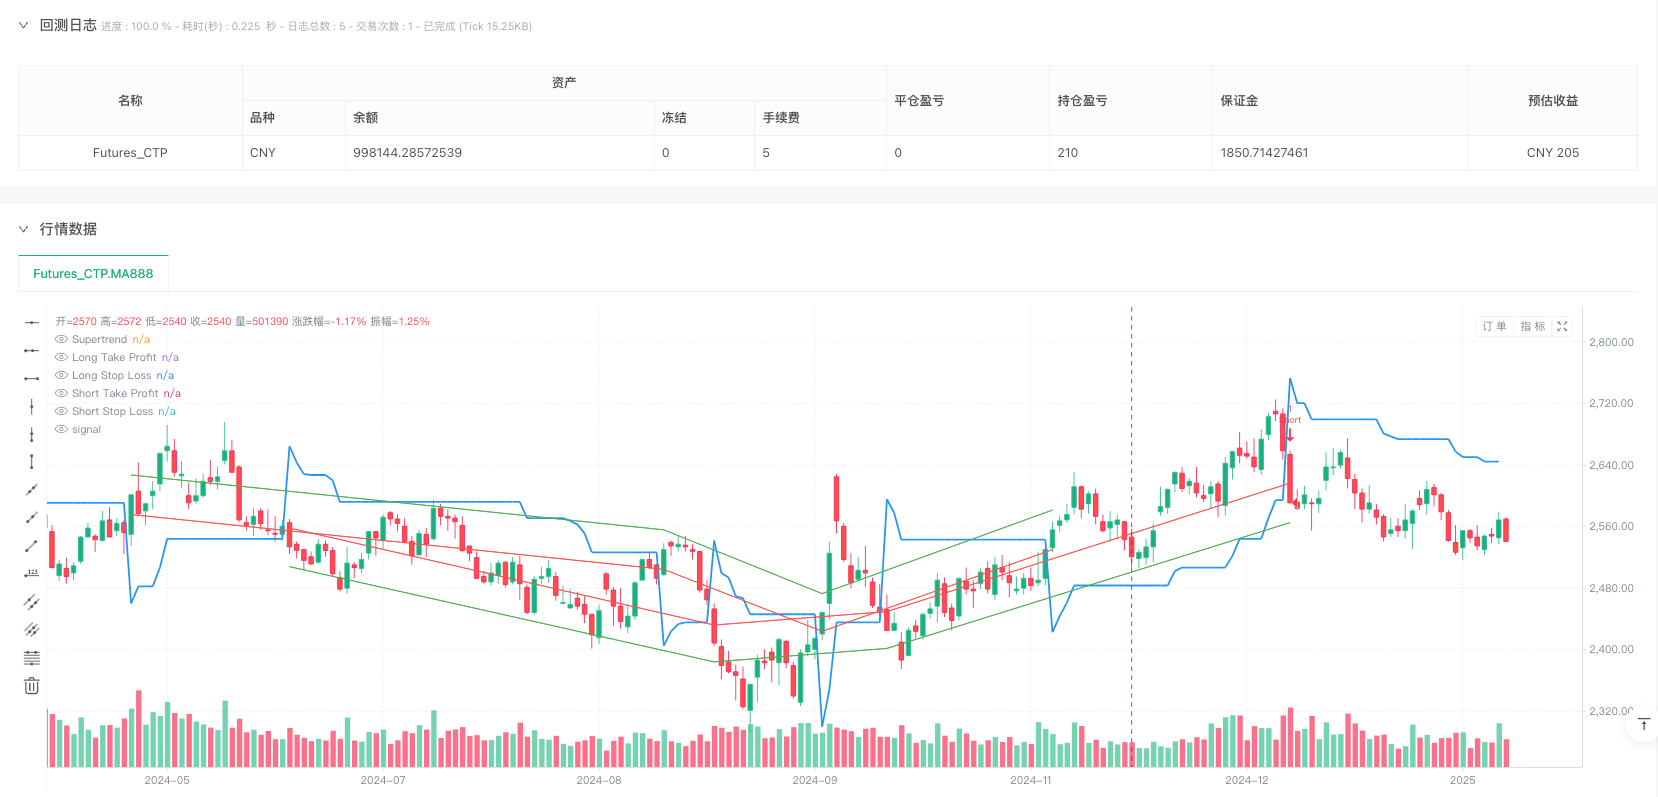
- Plots the Supertrend line on the chart to help identify current trend direction
- Displays stop loss and take profit levels, increasing trade visualization
This strategy is written in Pine Script 5.0, using the ta.supertrend function to directly obtain Supertrend indicator values and direction, simplifying code structure and improving computational efficiency.
Strategy Advantages
Trend Following Advantages:
- The Supertrend indicator effectively identifies market trends, reducing losses from false breakouts
- The indicator has strong noise filtering capability, improving signal quality
Precise Risk Management:
- Fixed percentage stop loss and take profit settings make risk control more precise and consistent
- Risk for each trade can be calculated in advance, facilitating capital management
Adjustable Parameters:
- ATR period and multiplier factor can be adjusted according to different market conditions
- Take profit and stop loss percentages can be customized according to individual risk preferences and market volatility
Visualized Trading Process:
- Intuitively displays Supertrend line, take profit, and stop loss levels on the chart
- Enhances transparency and confidence in trading decisions
Concise and Efficient Code:
- Utilizes built-in functions of Pine Script 5.0, with clear code structure
- Calculation logic is intuitive, easy to understand and maintain
Strategy Risks
Range-Bound Market Risk:
- In sideways markets, frequent price crossovers of the Supertrend line may lead to consecutive losses
- Solution: Add filtering conditions, such as combining directional indicators (like ADX) to confirm trend strength
Fixed Percentage Risk:
- 1% stop loss and take profit may be too large or too small in markets with different volatility
- Solution: Dynamically link stop loss and take profit percentages with market volatility (such as ATR)
Trend Reversal Delay:
- The Supertrend indicator is a lagging indicator and may not signal promptly at the beginning of trend reversals
- Solution: Combine leading indicators such as momentum indicators to optimize entry timing
Parameter Sensitivity:
- The selection of ATR period and multiplier factor has a significant impact on strategy performance
- Solution: Conduct comprehensive parameter optimization and backtesting to find the most suitable parameter combinations for specific markets
Close Take Profit Level:
- 1% take profit may lock in profits too early, missing out on benefits from major trends
- Solution: Implement trailing stop loss or partial take profit strategies, retaining some positions to follow trends
Strategy Optimization Directions
Dynamic Stop Loss and Take Profit:
- Change the fixed 1% stop loss and take profit to ATR-based dynamic levels
- Optimization rationale: Better adapt risk management to market volatility, improving strategy adaptability
Multi-Period Confirmation:
- Add trend confirmation mechanisms from higher timeframes
- Optimization rationale: Reduce false signals, improve trade quality, avoid operating against the main trend
Intelligent Position Management:
- Dynamically adjust position size based on market volatility and signal strength
- Optimization rationale: Increase risk exposure when high-confidence signals appear, improving capital utilization efficiency
Add Filtering Conditions:
- Combine volume, momentum indicators, or volatility indicators to filter trading signals
- Optimization rationale: Reduce low-quality signals, improve strategy stability and win rate
Optimize Supertrend Parameters:
- Implement adaptive parameter adjustment mechanisms, dynamically adjusting ATR period and multiplier based on market conditions
- Optimization rationale: Improve the indicator’s adaptability to different market environments, reduce overfitting risk
Summary
The “Multi-Period Supertrend Percentage Risk Management Strategy” is a quantitative trading system that combines trend following with precise risk management. The strategy captures market trend changes through the Supertrend indicator and controls risk using fixed percentage take profit and stop loss levels.
The main advantages of this strategy include clear operational rules, controllable risk, and adjustable parameters, making it suitable for use as a basic trading system. At the same time, the strategy also has disadvantages such as poor performance in oscillating markets and inflexible fixed percentage risk.
To further enhance strategy performance, consider introducing dynamic stop loss and take profit, multi-period confirmation, intelligent position management, and other optimization measures. Through these improvements, the strategy has the potential to further increase win rate and risk-adjusted returns while maintaining its original advantages.
This strategy is suitable for medium to long-term trend traders, especially those who value risk management and pursue stable returns. With reasonable parameter adjustments and strategy optimization, it can become a reliable trading system component.
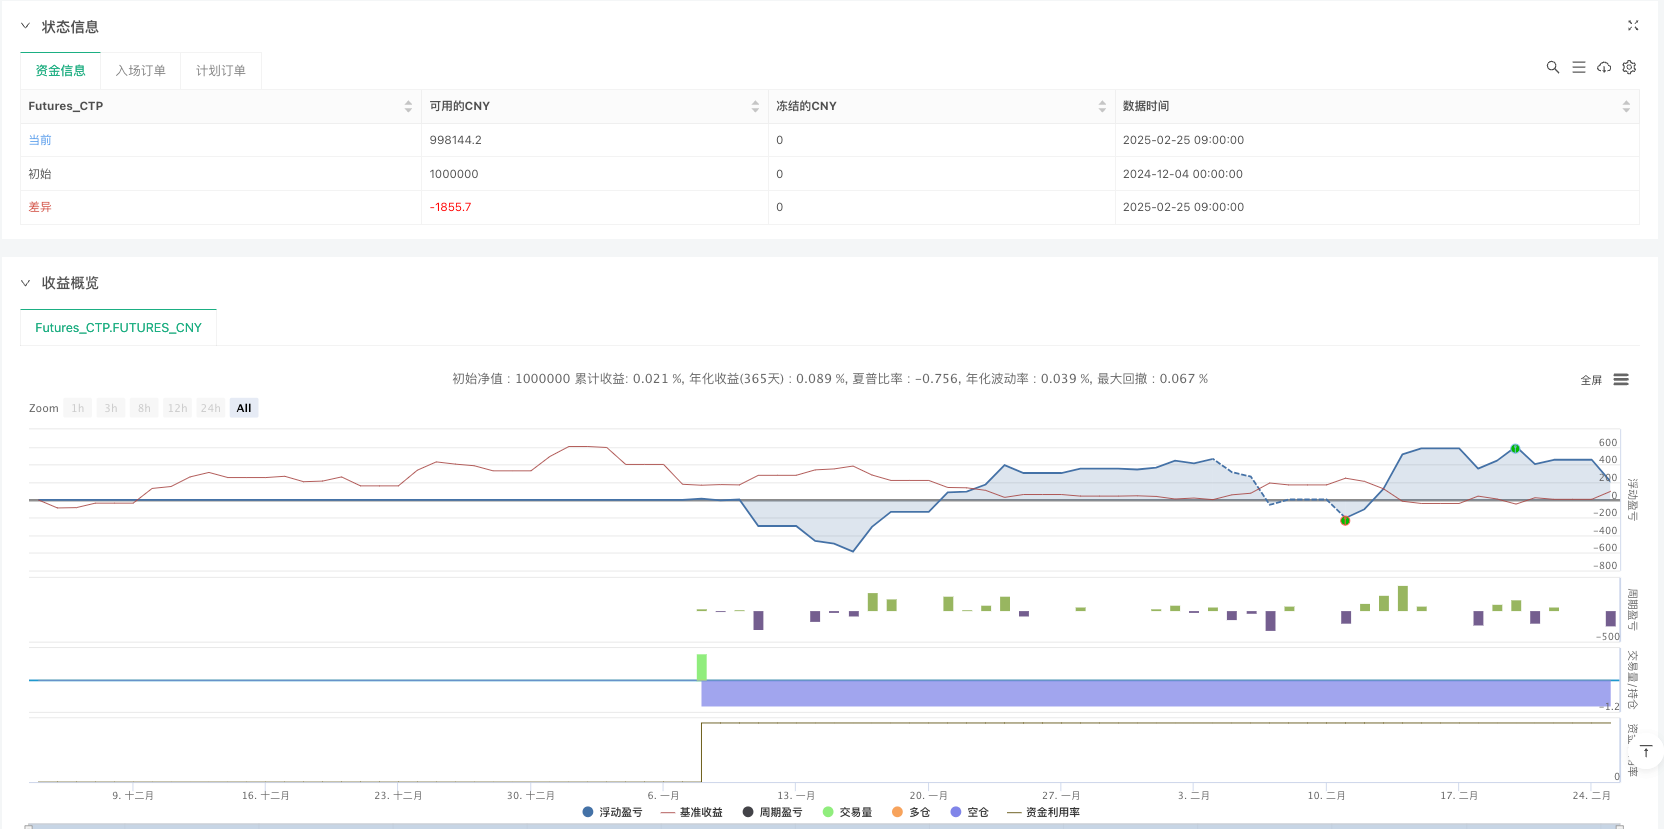
/*backtest
start: 2024-12-04 00:00:00
end: 2025-02-25 15:00:00
period: 1d
basePeriod: 1d
exchanges: [{"eid":"Futures_CTP","currency":"FUTURES"}]
*/

//@version=5
strategy("Supertrend with 1% Target and 1% Stoploss", overlay=true)

// Input parameters
atr_length = input.int(14, title="ATR Length")
factor = input.float(3.0, title="Factor")
target_pct = input.float(1.0, title="Target Percentage", minval=0.1) / 100
stoploss_pct = input.float(1.0, title="Stop Loss Percentage", minval=0.1) / 100

// Supertrend calculation
[supertrend, direction] = ta.supertrend(factor, atr_length)

// Plot the Supertrend line
plot(supertrend, color=color.blue, linewidth=2, title="Supertrend")

// Long and Short conditions
long_condition = ta.crossover(close, supertrend)
short_condition = ta.crossunder(close, supertrend)

// Calculate stop loss and take profit levels
long_stop_loss = close * (1 - stoploss_pct)
long_take_profit = close * (1 + target_pct)

short_stop_loss = close * (1 + stoploss_pct)
short_take_profit = close * (1 - target_pct)

// Long position entry
if long_condition
    strategy.entry("Long", strategy.long, stop=long_stop_loss, limit=long_take_profit)

// Short position entry
if short_condition
    strategy.entry("Short", strategy.short, stop=short_stop_loss, limit=short_take_profit)

// Plot stoploss and take profit levels for visual reference
plot(long_condition ? long_take_profit : na, color=color.green, style=plot.style_line, linewidth=1, title="Long Take Profit")
plot(long_condition ? long_stop_loss : na, color=color.red, style=plot.style_line, linewidth=1, title="Long Stop Loss")

plot(short_condition ? short_take_profit : na, color=color.green, style=plot.style_line, linewidth=1, title="Short Take Profit")
plot(short_condition ? short_stop_loss : na, color=color.red, style=plot.style_line, linewidth=1, title="Short Stop Loss")