## Strategy Overview
This strategy is a trend-following trading system based on multiple technical indicators, primarily utilizing moving average crossovers, Relative Strength Index (RSI), and Bollinger Bands to identify market trends and confirm trading signals. The strategy is particularly suited for fast-paced trading environments, integrating multiple indicators to filter out false signals and improve trading success rates. The core of the strategy relies on the crossover between fast and slow Exponential Moving Averages (EMA) to identify trend changes, while using the 200-day Simple Moving Average (SMA) to confirm the overall trend direction, and further validating trade signals through RSI and Bollinger Band middle band. Additionally, the strategy incorporates a dynamic stop-loss and take-profit mechanism based on Average True Range (ATR) to control risk and lock in profits.
Strategy Principles
The core logic of this strategy is based on the following key components:
Trend Confirmation Mechanism: The strategy uses the crossover between 9-period EMA and 21-period EMA to capture short-term trend changes. When the fast EMA crosses above the slow EMA, it’s considered a potential long signal; conversely, it’s viewed as a potential short signal. Meanwhile, the price position relative to the 200-period SMA is used to confirm the medium to long-term trend direction.
Multiple Filtering Conditions: To reduce false signals, the strategy requires:
- For long signals: RSI value must be greater than 50 (indicating upward momentum) and price must be above the Bollinger Band middle line (confirming uptrend)
- For short signals: RSI value must be less than 50 (indicating downward momentum) and price must be below the Bollinger Band middle line (confirming downtrend)
Dynamic Risk Management: The strategy uses 14-period ATR to calculate dynamic stop-loss and take-profit levels:
- Long stop-loss is set at the entry price minus ATR multiplied by the stop-loss factor
- Long take-profit is set at the entry price plus ATR multiplied by the take-profit factor
- Short trades use the opposite configuration
Visual Trade Signals: The strategy displays buy and sell signals on the chart through green up arrows and red down arrows, allowing traders to quickly identify trading opportunities.
Strategy Advantages
This strategy offers several significant advantages:
Multiple Confirmation Mechanism: By integrating multiple technical indicators (EMA, SMA, RSI, and Bollinger Bands), the strategy can effectively filter out false signals that might be generated by a single indicator, improving trading quality.
Trend Following and Momentum Combination: The strategy not only captures trends (through moving average crossovers) but also considers market momentum (through RSI), a combination that better identifies potential high-probability trading opportunities.
Adaptive Risk Management: Using ATR-based dynamic stop-loss and take-profit, the strategy can automatically adjust risk parameters according to market volatility, providing wider stop-loss space when volatility increases and tighter stop-loss range when volatility decreases.
Parameter Customizability: The strategy allows adjustment of key parameters (such as moving average periods, ATR period, take-profit and stop-loss multipliers, etc.), enabling traders to optimize strategy performance based on different market conditions and personal risk preferences.
Intuitive Visual Feedback: The strategy clearly marks buy and sell signals on the chart, helping traders quickly analyze and make decisions, particularly suitable for fast-paced trading environments.
Strategy Risks
Despite its well-designed nature, the strategy still has the following potential risks:
Ranging Market Risk: In sideways markets without clear trends, moving average crossovers may generate frequent false signals, leading to consecutive losses. The solution is to add additional oscillator indicators (such as ADX) to identify trendless markets and pause trading.
Lag Risk: Moving averages are inherently lagging indicators and may cause entry signals to appear at relatively late stages of a trend. This can be improved by adjusting moving average periods or incorporating leading indicators.
Black Swan Event Risk: In extreme market volatility situations, prices may instantly jump past stop-loss positions, causing actual losses to exceed expectations. It is recommended to use account-level risk control measures to limit single trade risk exposure.
Parameter Sensitivity: Strategy performance is highly dependent on parameter settings, and different market conditions may require different parameters. Comprehensive backtesting and parameter optimization are recommended, as well as considering adaptive parameter methods.
Over-optimization Risk: Excessive optimization of parameters for specific historical data may lead to poor strategy performance in live trading. Out-of-sample testing and forward testing should be used to verify strategy robustness.
Strategy Optimization Directions
Based on in-depth analysis of the code, the strategy can be optimized in the following directions:
Add Trend Strength Filter: Integrate Average Directional Index (ADX) as a trend strength indicator, considering trading signals only when the ADX value exceeds a specific threshold (e.g., 25), which helps avoid trading in weak trend or ranging markets.
Optimize Entry Timing: The current strategy enters immediately at moving average crossovers; consider adding pullback confirmation conditions, such as waiting for the price to retreat to near the fast EMA before entering, which may obtain better entry prices.
Dynamically Adjust Take-Profit Ratio: Based on market volatility or trend strength, dynamically adjust the take-profit multiplier, using higher multipliers in strong trend markets and lower multipliers in weak trend markets to maximize profit capture.
Add Partial Profit Locking Mechanism: When the price moves a certain distance in a favorable direction, consider partial position closure or moving stop-loss to breakeven, which can secure some profits while allowing the remaining position to continue following the trend.
Add Trading Time Filter: Certain periods (such as market opening, closing, or important news release times) may have abnormally high volatility; adding time filters can help avoid trading during these high-risk periods.
Integrate Volume Confirmation: The current strategy does not consider volume factors; adding volume confirmation conditions requiring above-average volume when trading signals appear helps confirm the validity of price breakouts.
Add Market State Adaptive Mechanism: Develop logic that can automatically identify whether the market is in a trending or ranging state, and dynamically adjust trading parameters or strategy modes accordingly.
Summary
This multi-indicator confirmation trend trading strategy successfully integrates various technical analysis tools to form a relatively comprehensive trading system. By capturing trend changes through moving average crossovers, confirming signals with RSI and Bollinger Bands, and using ATR to set dynamic take-profit and stop-loss levels, the strategy provides a fairly complete trading logic and risk management framework while remaining relatively concise.
The main advantages of the strategy lie in its multiple confirmation mechanisms and adaptive risk management system, which enable it to perform well in markets with clear trends. However, it may face challenges in ranging markets and has certain lag risks. Through adding trend strength filtering, optimizing entry timing, incorporating partial profit locking and volume confirmation, the strategy can potentially further improve its robustness and profitability.
Most importantly, any trading strategy should be adjusted according to specific market conditions and personal risk preferences. It is recommended to conduct thorough backtesting verification before live application, and to start with small positions to gradually test the strategy’s performance in actual markets. Regular reassessment and optimization of strategy parameters as market conditions change is also crucial.
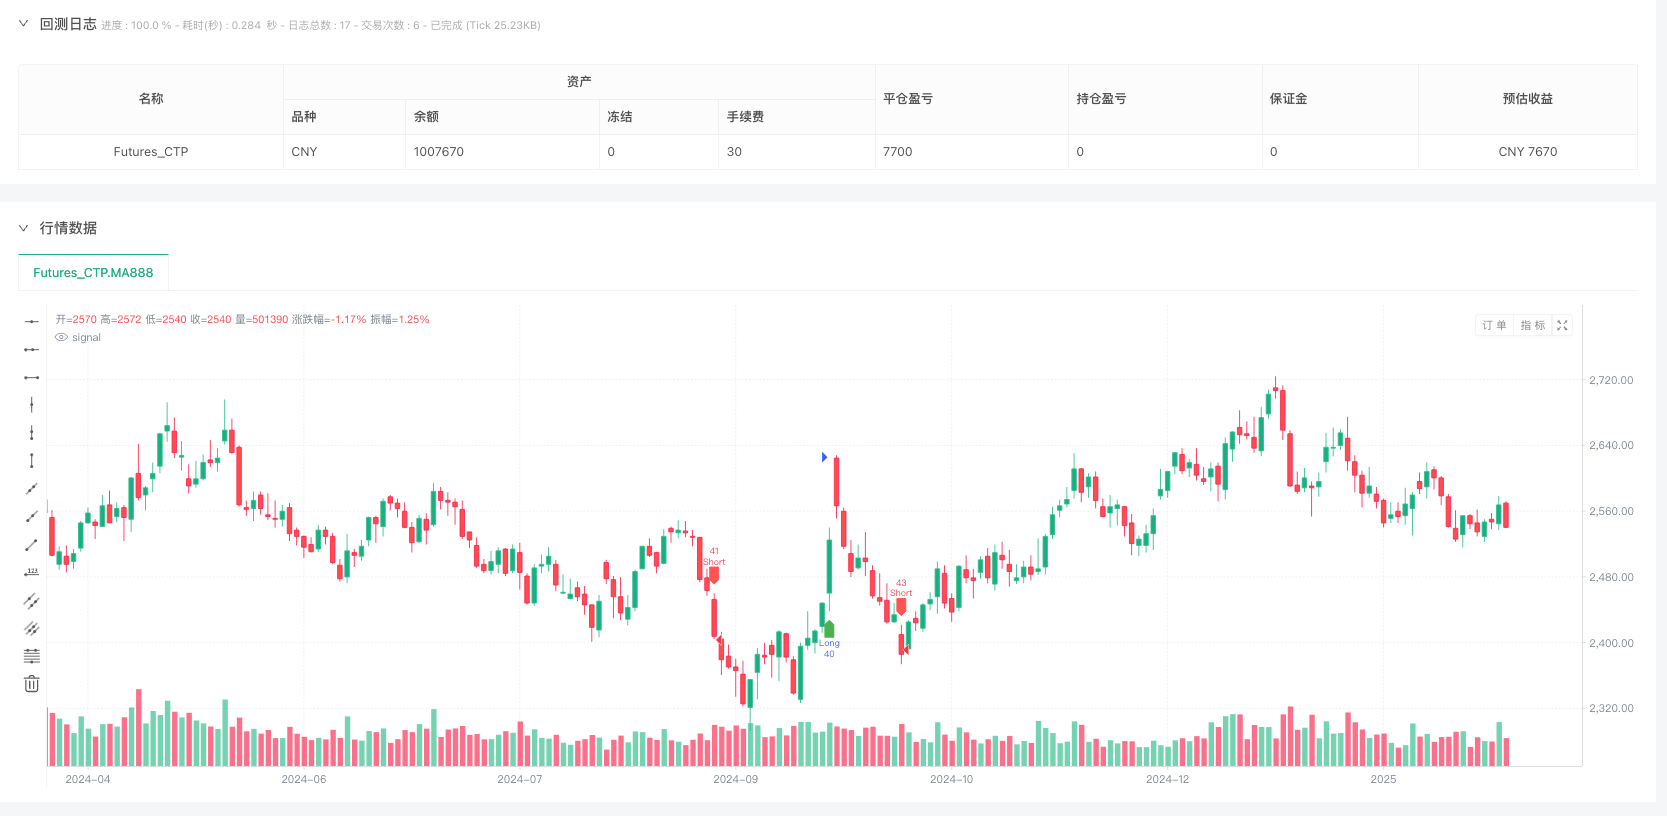
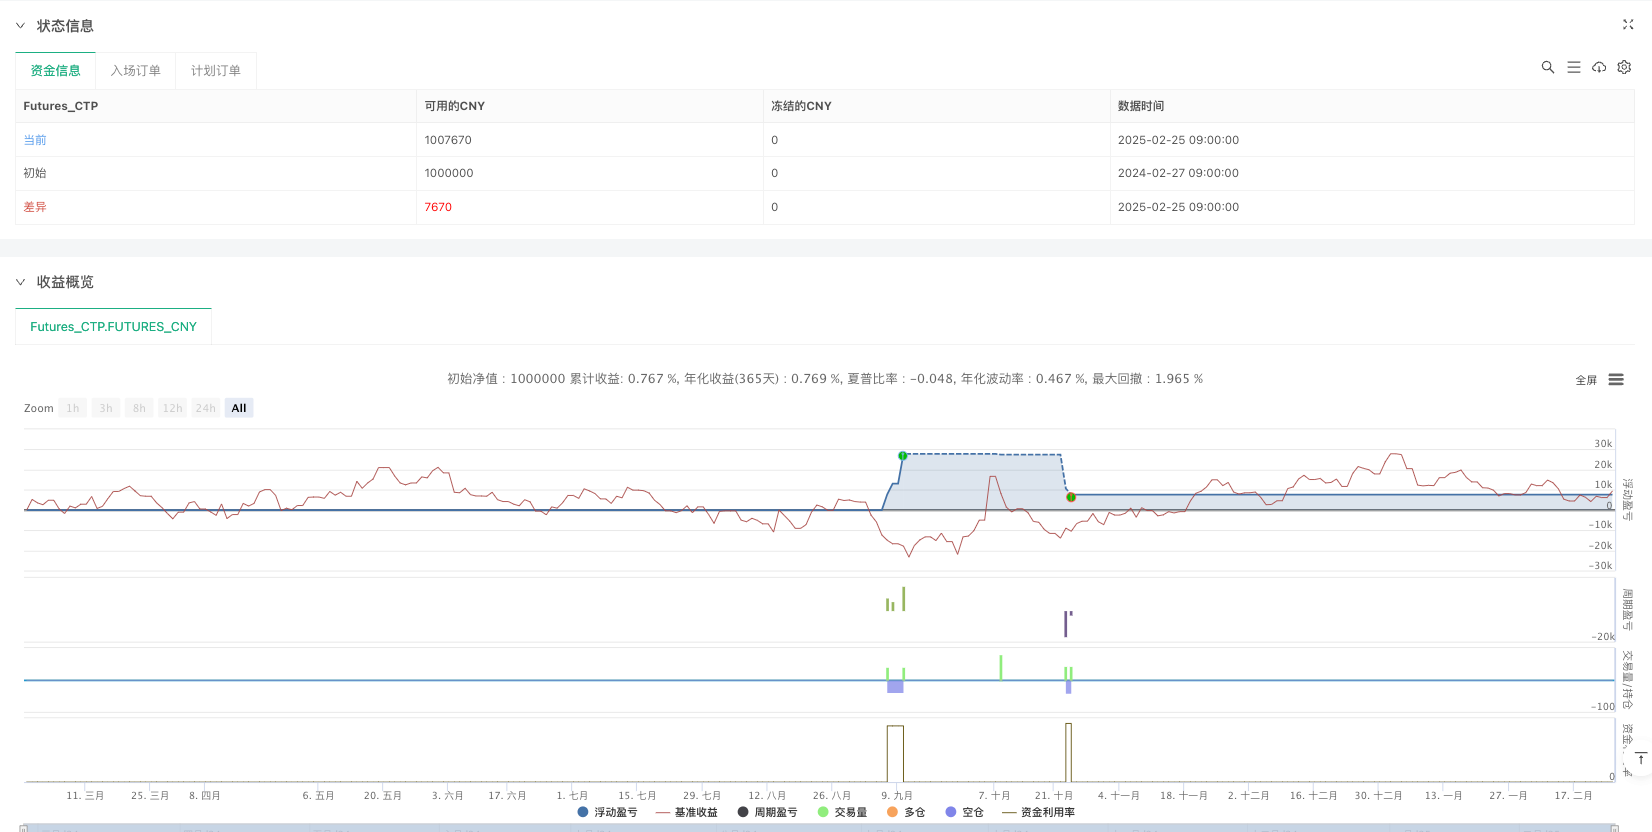
/*backtest
start: 2024-02-27 09:00:00
end: 2025-02-25 15:00:00
period: 1d
basePeriod: 1d
exchanges: [{"eid":"Futures_CTP","currency":"FUTURES"}]
*/

//@version=5
strategy("Scalping BTC/USD Optimisé", overlay=true, default_qty_type=strategy.percent_of_equity, default_qty_value=10)

// --- Paramètres des indicateurs ---
ema_fast = ta.ema(close, 9)
ema_slow = ta.ema(close, 21)
sma_trend = ta.sma(close, 200)
rsi_value = ta.rsi(close, 14)

// --- Définition des Bandes de Bollinger ---
[bb_upper, bb_middle, bb_lower] = ta.bb(close, 20, 2)

// --- Paramètres de trading ---
take_profit_multiplier = 2.0
stop_loss_multiplier = 1.0
atr_value = ta.atr(14)

// --- Conditions d'entrée ---
longCondition = ta.crossover(ema_fast, ema_slow) and close > sma_trend and rsi_value > 50 and close > bb_middle
shortCondition = ta.crossunder(ema_fast, ema_slow) and close < sma_trend and rsi_value < 50 and close < bb_middle

// --- Définition du TP et SL ---
long_sl = close - atr_value * stop_loss_multiplier
long_tp = close + atr_value * take_profit_multiplier
short_sl = close + atr_value * stop_loss_multiplier
short_tp = close - atr_value * take_profit_multiplier

// --- Exécution des trades ---
if longCondition
    strategy.entry("Long", strategy.long)
    strategy.exit("Take Profit Long", from_entry="Long", limit=long_tp, stop=long_sl)

if shortCondition
    strategy.entry("Short", strategy.short)
    strategy.exit("Take Profit Short", from_entry="Short", limit=short_tp, stop=short_sl)

// --- Correction du problème de plotshape ---
plot_buy_signal = longCondition ? 1 : na
plot_sell_signal = shortCondition ? 1 : na

plotshape(series=plot_buy_signal, location=location.belowbar, color=color.green, style=shape.labelup, title="BUY")
plotshape(series=plot_sell_signal, location=location.abovebar, color=color.red, style=shape.labeldown, title="SELL")