#### Overview The Dual EMA Volatility-Adaptive Trading Strategy with Multi-Tiered Profit Optimization System is an efficient quantitative trading strategy designed for short-term traders. The core of this strategy relies on crossover signals between fast-moving average (EMA5) and slow-moving average (EMA15), combined with RSI momentum confirmation, and uses the ATR volatility indicator to dynamically adjust stop-loss and profit levels. The system employs a two-tier profit model, closing positions at different volatility multiples, which ensures both rapid securing of partial profits and the ability to capture extended price movements, forming a comprehensive risk and reward management framework.
Strategy Principles
This strategy utilizes the crossover of two Exponential Moving Averages (EMA) as the basic entry signal, supplemented by the Relative Strength Index (RSI) for secondary confirmation, and combines the Average True Range (ATR) to set dynamic stop-loss and profit targets. The specific implementation principles are as follows:
Entry Conditions: - Buy Signal: When the 5-period EMA crosses above the 15-period EMA, and RSI is greater than 50, indicating upward short-term momentum with sufficient strength - Sell Signal: When the 5-period EMA crosses below the 15-period EMA, and RSI is less than 50, indicating downward short-term momentum with confirmed downtrend
Dynamic Risk Management: - Stop Loss (SL): Set at current price minus 1x ATR value (for long positions) or plus 1x ATR value (for short positions) - First Profit Target (TP1): Set at current price plus 1.5x ATR value (for long positions) or minus 1.5x ATR value (for short positions), closing 50% of the position here - Second Profit Target (TP2): Set at current price plus 3x ATR value (for long positions) or minus 3x ATR value (for short positions), closing the remaining 50% of the position
The core design philosophy of the strategy is to capture trend turning points through EMA crossovers, filter signal quality through RSI, and use ATR to dynamically adjust exit levels, enabling the strategy to adapt to different market volatility environments.
Strategy Advantages
Dynamic Risk Management: Using ATR as a volatility reference benchmark allows the strategy to automatically adapt to different volatility environments, automatically widening stop-loss and profit spaces in high-volatility markets, and automatically tightening stop-loss and profit levels in low-volatility markets.
Tiered Profit Structure: The strategy adopts a two-tier profit model (1.5x ATR and 3x ATR), closing 50% of the position when reaching the first tier target, which ensures both rapid locking of partial profits and allows the remaining position to continue capturing larger movements.
Multiple Confirmation Mechanism: Through the dual confirmation of EMA crossover and RSI indicator, many false signals are effectively filtered out, improving the accuracy of trades.
Visualized Trade Management: The strategy clearly marks buy and sell signals as well as dynamically calculated stop-loss and profit levels on the chart, greatly improving the operability and transparency of trading.
Automated Alert System: Built-in alert conditions can automatically notify traders when trading signals are triggered, avoiding missed trading opportunities.
Strong Parameter Adaptability: The strategy provides customizable settings for ATR multiples, allowing traders to flexibly adjust according to their risk preferences.
Strategy Risks
Rapid Market Reversal Risk: Since the strategy is based on short-period EMA crossovers, frequent signal reversals may occur during severe market fluctuations or false breakouts, leading to consecutive stop-losses. The solution is to pause trading during major news releases or extreme volatility markets, or to add additional market environment filtering conditions.
Fixed Proportion Stop-Loss Inadequacy: Although ATR dynamic adjustment provides a certain adaptability, in cases of structural market changes (such as gaps), a 1x ATR stop-loss may not be sufficient to protect capital. It is recommended to adjust the ATR multiplier in live trading based on the historical volatility characteristics of the specific product.
Parameter Sensitivity: The choice of EMA periods and RSI thresholds has a significant impact on strategy performance, and optimal parameters may change under different market conditions. It is recommended to determine suitable parameter combinations for the target market through historical data backtesting.
Intraday Liquidity Risk: During market sessions with lower volatility, the stop-loss range calculated by ATR may be too small, causing stop-losses to be triggered due to slight price fluctuations. A minimum stop-loss point can be set as a bottom-line protection.
Trading Cost Impact: The strategy is designed for short-term trading, and frequent trading will generate higher trading costs. In practical applications, the erosion of spreads and commissions on returns needs to be weighed.
Strategy Optimization Directions
Introduce Trading Session Filtering: The code already suggests trading during high volatility sessions (such as the London-New York cross session), but this restriction is not hard-coded in the algorithm. A filter based on market time can be added to generate signals only during optimal trading sessions, avoiding false signals during low volatility periods.
Optimize RSI Period and Threshold: The current RSI uses the standard 14-period and middle threshold of 50, which can be adjusted according to specific market characteristics to match the timeframe used, and consider using asymmetric thresholds (such as 55 for long positions and 45 for short positions) to adapt to potential market biases.
Add Trend Filter: Although EMA crossovers already provide trend direction indication, adding a longer-period trend indicator (such as 50-period EMA) as a global trend filter can be considered, only taking positions in the direction of the larger trend to improve success rate.
Dynamic Position Management: The current strategy uses a fixed position (0.1), but dynamic position management based on ATR or balance proportion can be implemented to automatically adjust position size in different volatility environments, maintaining consistency in risk exposure.
Drawdown Control Mechanism: Add drawdown control logic based on account equity, automatically reducing trading size or pausing trading when a specific drawdown threshold is reached, protecting capital safety.
Signal Quality Weighting: Signals can be scored for quality (such as based on EMA crossover angle, RSI reading strength, etc.), and position size or stop-loss width can be dynamically adjusted according to the score, giving greater weight to high-quality signals.
Summary
The Dual EMA Volatility-Adaptive Trading Strategy with Multi-Tiered Profit Optimization System is a short-term trading system that organically combines technical indicators, dynamic risk management, and multi-tier profit targets. Its core advantages lie in strong adaptability, strict risk control, and good visualization and automation features. By capturing price momentum changes through EMA crossovers, confirming signal validity with RSI, and dynamically adjusting exit levels with ATR, a complete trading loop is formed.
This strategy is particularly suitable for short-term traders to apply in high-liquidity and volatility markets, but users need to pay attention to market condition screening and parameter optimization to cope with changes in different market environments. Through the suggested optimization directions, there is room for further performance improvement of the strategy, especially in adding trend filtering and dynamic position management. Overall, this is a reasonably designed, logically clear, and practically strong quantitative trading strategy.
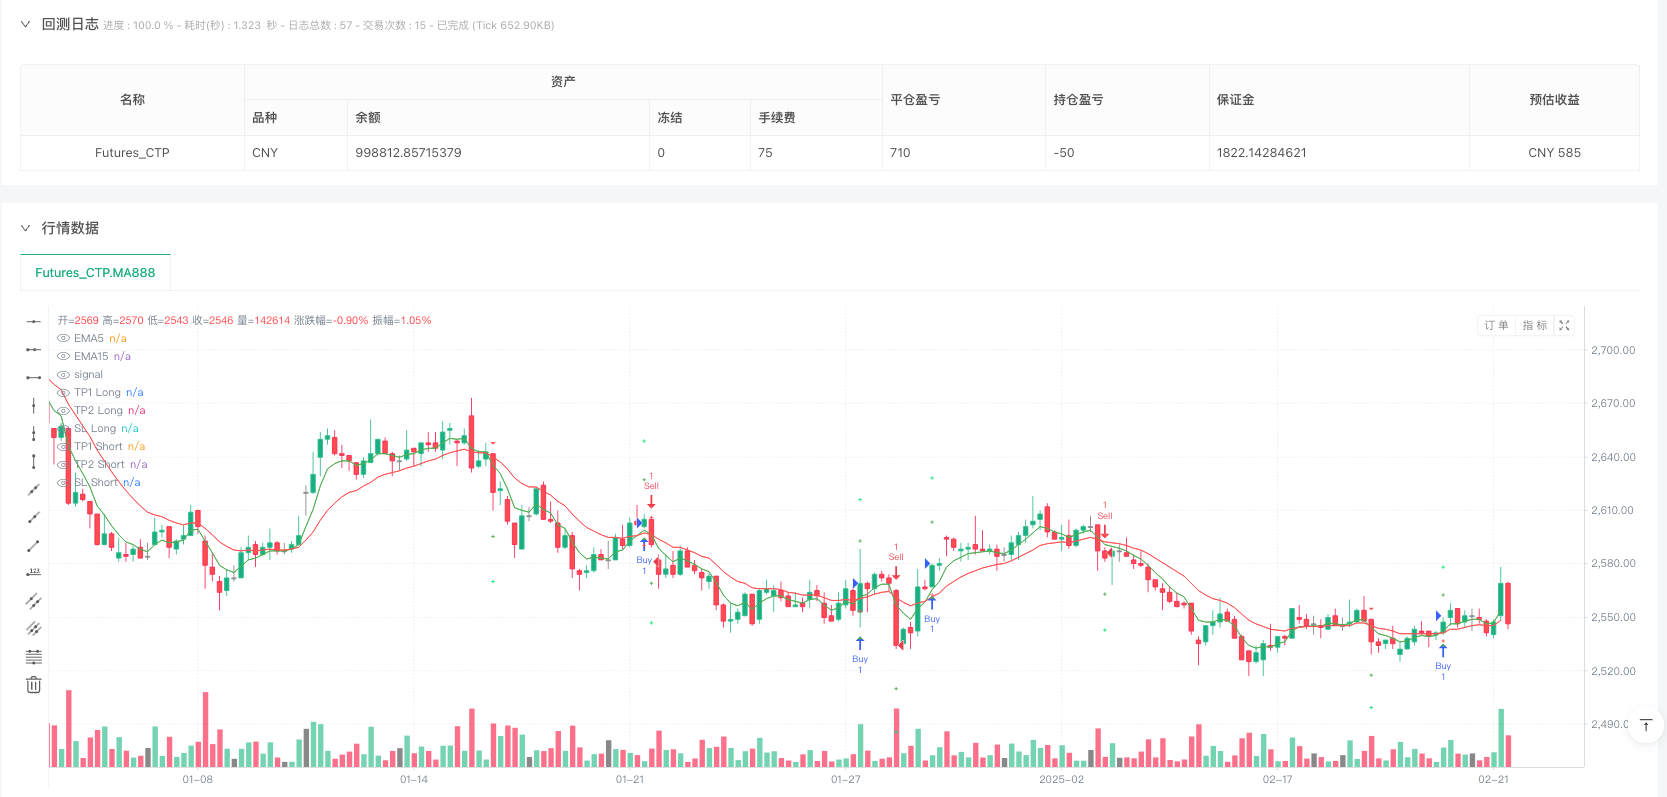
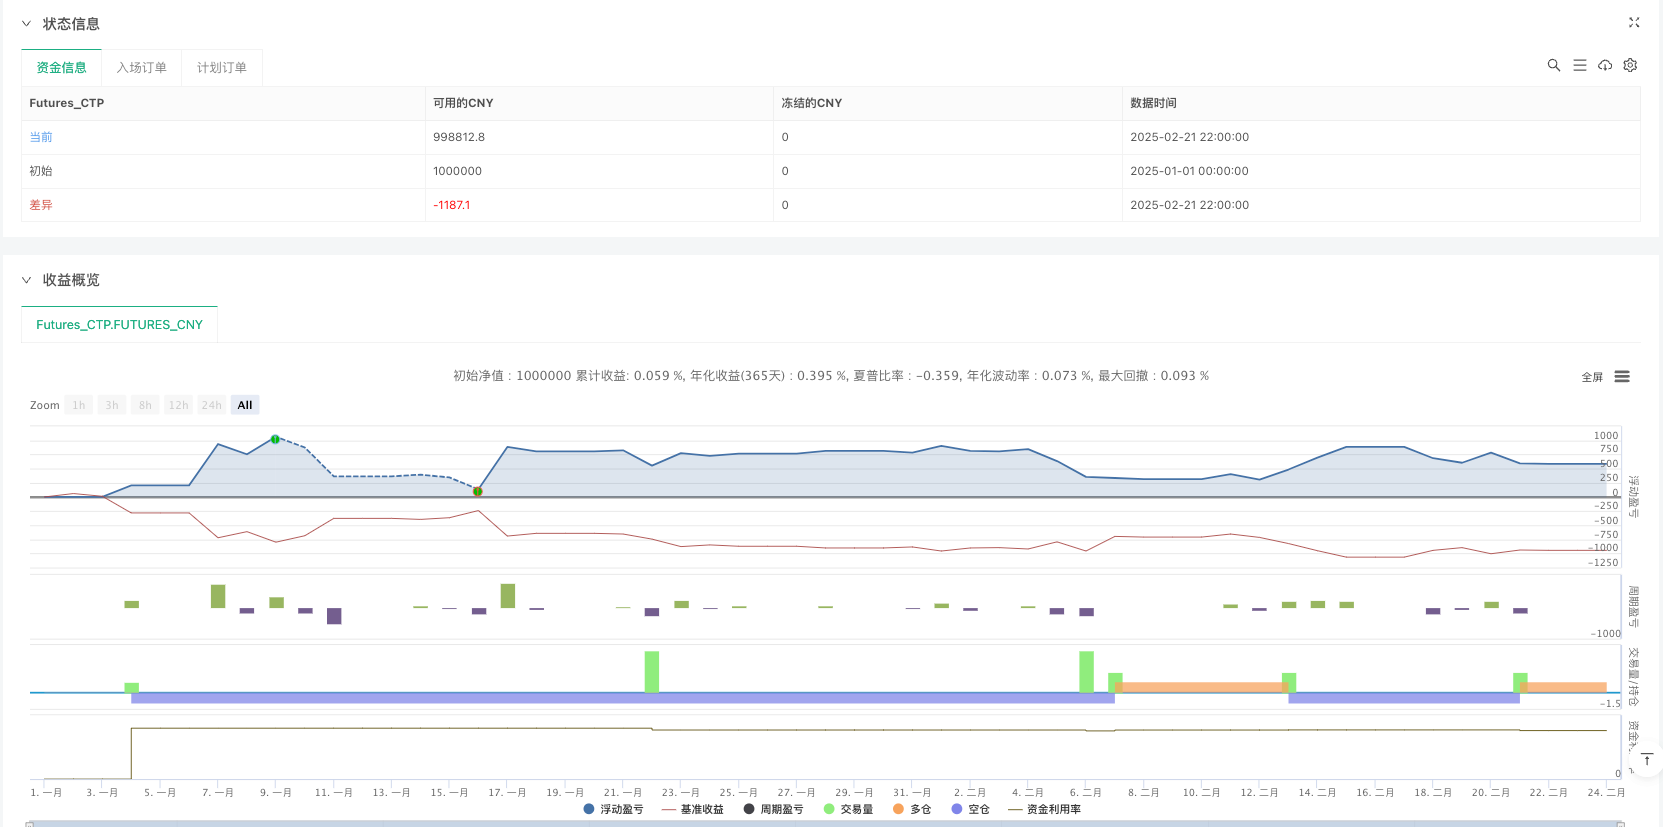
/*backtest
start: 2025-01-01 00:00:00
end: 2025-02-24 00:00:00
period: 1h
basePeriod: 1m
exchanges: [{"eid":"Futures_CTP","currency":"FUTURES"}]
*/

//@version=5
strategy("Scalping XAUUSD with Alerts By Fahrizal", overlay=true, default_qty_type=strategy.fixed, default_qty_value=0.1)

// Input custom
tpMultiplier1 = input.float(1.5, "TP1 Multiplier (ATR)", minval=0.5, step=0.1)
tpMultiplier2 = input.float(3.0, "TP2 Multiplier (ATR)", minval=1.0, step=0.1)
slMultiplier = input.float(1.0, "SL Multiplier (ATR)", minval=0.5, step=0.1)

// Definisi indikator
emaFast = ta.ema(close, 5)
emaSlow = ta.ema(close, 15)
rsi = ta.rsi(close, 14)
atr = ta.atr(14)

// Variabel buat nyimpan level
var float longSL = na
var float longTP1 = na
var float longTP2 = na
var float shortSL = na
var float shortTP1 = na
var float shortTP2 = na

// Plot ke chart
plot(emaFast, color=color.green, title="EMA5")
plot(emaSlow, color=color.red, title="EMA15")

// Kondisi beli/jual
buySignal = ta.crossover(emaFast, emaSlow) and rsi > 50
sellSignal = ta.crossunder(emaFast, emaSlow) and rsi < 50

// Hitung dan simpan level TP dan SL saat sinyal
if (buySignal)
    longSL := close - (atr * slMultiplier)
    longTP1 := close + (atr * tpMultiplier1)
    longTP2 := close + (atr * tpMultiplier2)
    strategy.entry("Buy", strategy.long)
    strategy.exit("TP1 Long", "Buy", qty_percent=50, limit=longTP1)
    strategy.exit("TP2 Long", "Buy", qty_percent=50, limit=longTP2)
    strategy.exit("SL Long", "Buy", stop=longSL)

if (sellSignal)
    shortSL := close + (atr * slMultiplier)
    shortTP1 := close - (atr * tpMultiplier1)
    shortTP2 := close - (atr * tpMultiplier2)
    strategy.entry("Sell", strategy.short)
    strategy.exit("TP1 Short", "Sell", qty_percent=50, limit=shortTP1)
    strategy.exit("TP2 Short", "Sell", qty_percent=50, limit=shortTP2)
    strategy.exit("SL Short", "Sell", stop=shortSL)

// Tampilin sinyal di chart
plotshape(buySignal, title="Buy", location=location.belowbar, color=color.green, style=shape.triangleup, size=size.small)
plotshape(sellSignal, title="Sell", location=location.abovebar, color=color.red, style=shape.triangledown, size=size.small)

// Tampilin level di chart pake label
if (buySignal)
    label.new(bar_index, high, "SL: " + str.tostring(longSL, "#.##") + "\nTP1: " + str.tostring(longTP1, "#.##") + "\nTP2: " + str.tostring(longTP2, "#.##"),
              color=color.blue, textcolor=color.white, style=label.style_label_down)
if (sellSignal)
    label.new(bar_index, low, "SL: " + str.tostring(shortSL, "#.##") + "\nTP1: " + str.tostring(shortTP1, "#.##") + "\nTP2: " + str.tostring(shortTP2, "#.##"),
              color=color.red, textcolor=color.white, style=label.style_label_up)

// Notifikasi simpel saat posisi dibuka
alertcondition(buySignal, title="Buy Alert", message="Buy Signal Detected! Check chart for SL, TP1, TP2 levels.")
alertcondition(sellSignal, title="Sell Alert", message="Sell Signal Detected! Check chart for SL, TP1, TP2 levels.")

// Plot level (opsional)
plot(buySignal ? longTP1 : na, "TP1 Long", color=color.green, style=plot.style_cross)
plot(buySignal ? longTP2 : na, "TP2 Long", color=color.lime, style=plot.style_cross)
plot(buySignal ? longSL : na, "SL Long", color=color.red, style=plot.style_cross)
plot(sellSignal ? shortTP1 : na, "TP1 Short", color=color.green, style=plot.style_cross)
plot(sellSignal ? shortTP2 : na, "TP2 Short", color=color.lime, style=plot.style_cross)
plot(sellSignal ? shortSL : na, "SL Short", color=color.red, style=plot.style_cross)