Overview
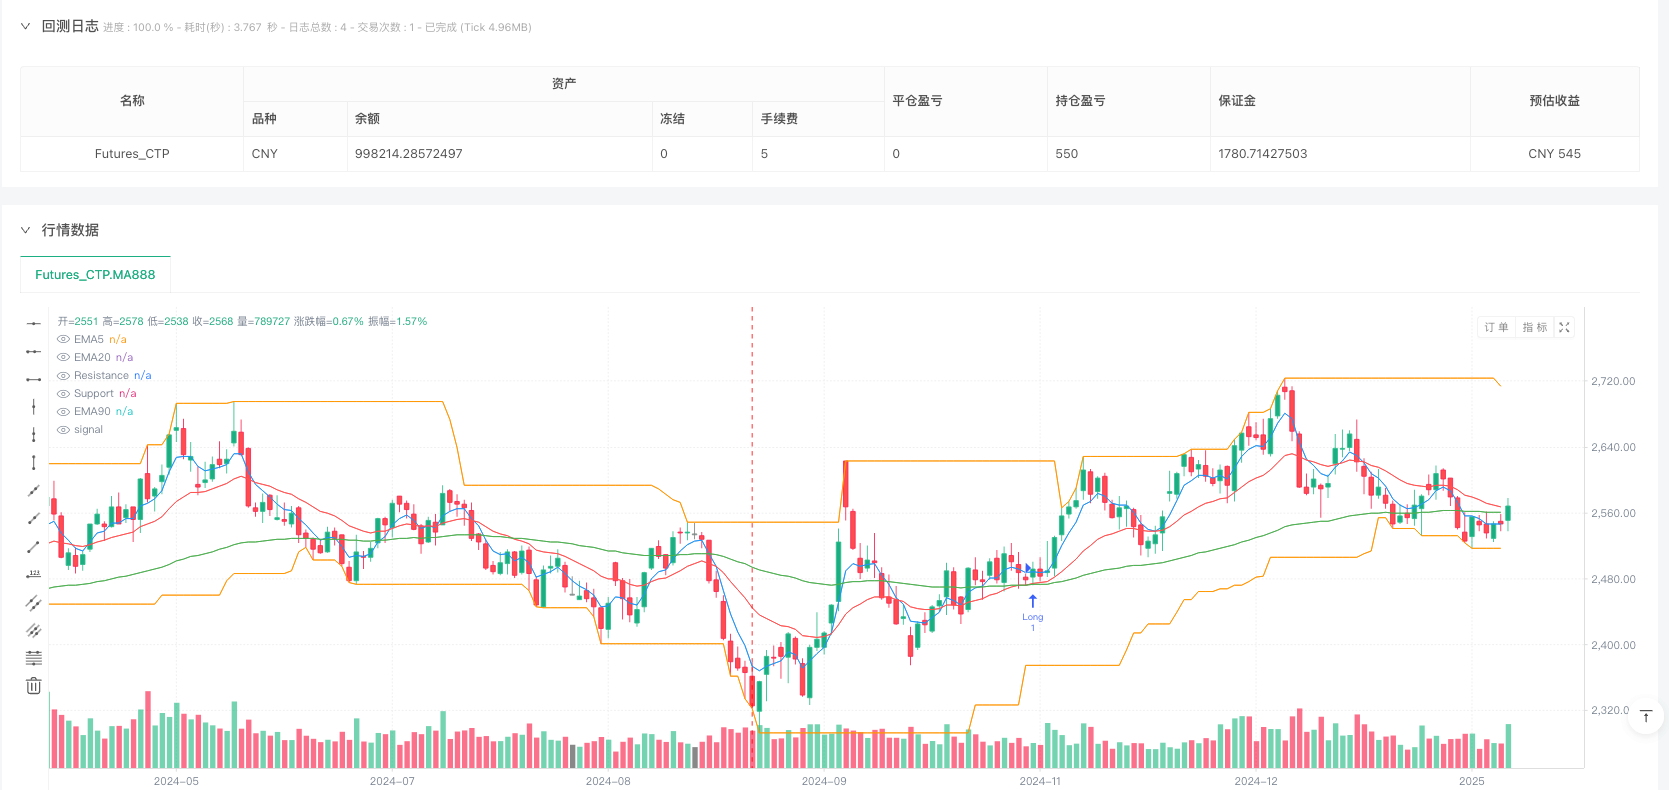
The Exponential Moving Average Candle Stop Trading Strategy is a quantitative trading system based on candlestick patterns and moving average trend confirmation. This strategy primarily identifies specific candlestick formations (known as “candle stop” signals) as entry points, while using EMA (Exponential Moving Average) crossovers to confirm the overall market trend and dynamic support and resistance levels to identify market breakouts. The strategy implements strict risk management mechanisms, including preset stop-loss positions and a take-profit strategy based on risk-reward ratios, ensuring controlled risk for each trade.
Strategy Principles
The core principle of this strategy is to identify specific candlestick patterns in the market that typically represent the possibility of short-term market reversals. The operational mechanism of the strategy is as follows:
Trend Determination: Market trends are determined by comparing the relative positions of EMA20 and EMA90. When EMA20 is above EMA90, an uptrend is identified; when EMA20 is below EMA90, a downtrend is identified.
Candle Stop Signal Identification:
- In an uptrend, a candle stop signal requires: a lower shadow length at least 0.8 times the body, an upper shadow smaller than the body, and a closing price higher than the opening price (bullish candle).
- In a downtrend, a candle stop signal requires: an upper shadow length at least 0.8 times the body, a lower shadow smaller than the body, and a closing price lower than the opening price (bearish candle).
Breakout Detection: Market breakouts are identified by comparing the current closing price with support/resistance levels (calculated based on the lowest/highest prices over 30 periods).
Entry Conditions: When the market is in a specific trend and not in a breakout state, if a candle stop signal appears, the strategy enters positions according to preset risk parameters (2.5% risk per trade).
Stop-Loss Setting: For long positions, the stop-loss is set at 2.5% below the entry price; for short positions, the stop-loss is set at 2.5% above the entry price.
Take-Profit Conditions: Based on a combination of profit percentage and risk-reward ratio conditions. Long positions require at least 7% profit and a risk-reward ratio of no less than 3; short positions require at least 6% profit and a risk-reward ratio of no less than 3.
Strategy Advantages
Clear Entry and Exit Signals: Provides clear trading signals through specific candlestick patterns and moving average trends, reducing the emotional impact of subjective judgment.
Comprehensive Trend Confirmation Mechanism: Uses EMA indicators from multiple time periods to confirm market trends, improving the reliability of trading signals.
Dynamic Support and Resistance Identification: Uses dynamically calculated support and resistance levels with a rolling window, allowing the strategy to adapt to different market phases.
Strict Risk Management: Preset risk parameters (2.5% risk per trade) and take-profit conditions based on risk-reward ratios ensure reasonable capital management.
Differentiated Long and Short Trading Standards: Sets different entry conditions and profit targets for long and short trades, adapting to the asymmetric characteristics of markets.
Dynamic Position Sizing: Automatically calculates appropriate position sizes based on stop-loss distance, ensuring consistent risk for each trade.
Strategy Risks
Indicator Lag: EMA, as a lagging indicator, may provide delayed signals in rapidly changing markets, resulting in suboptimal entry timing.
False Breakout Risk: Markets may exhibit false breakout phenomena, leading to erroneous signals. The solution is to introduce volume confirmation or increase breakout confirmation periods.
Sensitivity Adjustment Challenges: The parameters of candle stop signals (such as the ratio of shadows to body) need to be adjusted according to different markets and periods. Being too sensitive may lead to overtrading, while being too strict may miss opportunities.
Trend Transition Period Risk: During trend transition periods, the strategy may generate a series of losing trades. The solution is to add trend strength filters or reduce trading frequency when trends are unclear.
Inflexibility of Fixed Stop-Loss Distance: Using the same percentage stop-loss (2.5%) for all trades may not adapt to different market volatilities. Consider using volatility-based dynamic stop-loss distances.
Limitations of RSI Filter Conditions: Using RSI filtering only for short trades may create an imbalanced trading frequency. Consider introducing similar filtering mechanisms for long trades or optimizing current RSI parameters.
Strategy Optimization Directions
Volatility Adaptive Parameters: Introduce volatility indicators (such as ATR) to dynamically adjust the shadow ratio requirements of candle stop signals and stop-loss distances, allowing the strategy to better adapt to different market conditions.
Multi-Timeframe Confirmation: Reintroduce higher timeframe (such as 1-hour chart) trend confirmation to improve the reliability of trading signals and reduce the impact of false signals.
Entry Timing Optimization: Optimize entry timing by adding additional filtering conditions (such as trend strength indicators, volume confirmation) to increase trade success rates.
Partial Take-Profit Mechanism: Introduce a tiered take-profit mechanism that moves the stop-loss to breakeven or locks in partial profits after reaching certain profit levels, better balancing risk and reward.
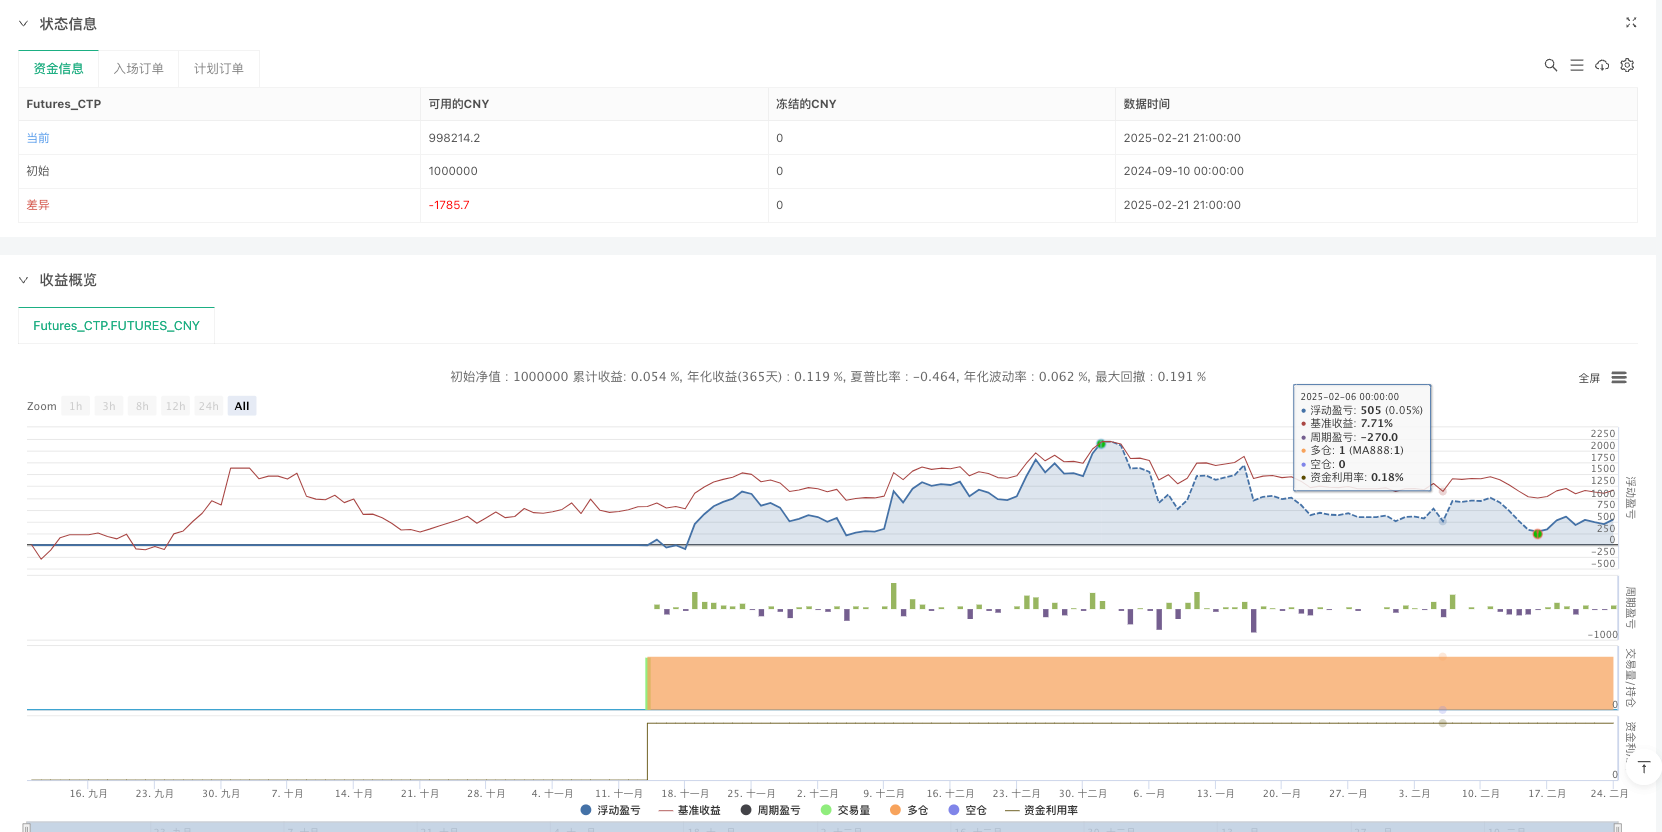
Backtesting Period Extension: Conduct more comprehensive backtesting under different market cycles and conditions to verify the strategy’s robustness and adaptability.
Machine Learning Optimization: Use machine learning methods to automatically optimize strategy parameters and find the optimal parameter combinations for specific markets.
Trading Frequency Control: Introduce trade count limits or cooling-off period mechanisms to avoid overtrading under unfavorable market conditions.
Summary
The Exponential Moving Average Candle Stop Trading Strategy is a quantitative trading system combining technical analysis and risk management, generating trading signals by identifying specific candlestick patterns and confirming trends. The main advantages of this strategy lie in its clear trading rules and strict risk control mechanisms, making trading decisions more systematic and disciplined. However, as with any technical analysis strategy, it also faces challenges such as indicator lag and adaptability to market changes.
By introducing improvements such as volatility adaptive parameters, multi-timeframe confirmation, and optimizing entry timing, this strategy has the potential to achieve more stable performance across different market environments. Particularly, applying machine learning methods to parameter optimization could significantly enhance the strategy’s adaptability and overall performance. Regardless, before deploying this strategy in practice, it is recommended to conduct thorough backtesting and forward testing to verify its performance under actual market conditions.
/*backtest
start: 2024-09-10 00:00:00
end: 2025-02-24 15:00:00
period: 1d
basePeriod: 1m
exchanges: [{"eid":"Futures_CTP","currency":"FUTURES"}]
*/
//@version=6
strategy("Advanced Candle Stop Strategy Backtest - Tuned v9 - Max Trades", overlay=true)
// --- EMA Variables ---
ema5_length = 5
ema20_length = 20
ema90_length = 90
ema5 = ta.ema(close, ema5_length)
ema20 = ta.ema(close, ema20_length)
ema90 = ta.ema(close, ema90_length)
// --- Support, Resistance, and Volume Calculation ---
lookback_support_resistance = 30
support_level = ta.lowest(low, lookback_support_resistance)
resistance_level = ta.highest(high, lookback_support_resistance)
// --- Volume Condition for Short (Removed) ---
avg_volume_lookback = 20
avg_volume = ta.sma(volume, avg_volume_lookback)
// --- RSI Condition for Short (Removed) ---
rsi_length = 14
rsi_overbought = 70
rsi = ta.rsi(close, rsi_length)
// --- Candle Stop Function ---
is_candle_stop(trend) =>
body = math.abs(close - open)
upper_shadow = high - math.max(open, close)
lower_shadow = math.min(open, close) - low
if trend == "up"
lower_shadow >= 0.8 * body and upper_shadow < body and close > open // Shadow ratio reduced to 0.8 for longs
else if trend == "down"
upper_shadow >= 0.8 * body and lower_shadow < body and close < open // Shadow ratio reduced to 0.8 for shorts - EMA5 and Volume conditions removed
else
false
// --- Trend Determination (only 15m, no 1H confirmation) ---
trend = ema20 > ema90 ? "up" : ema20 < ema90 ? "down" : "neutral"
final_trend = trend // حذف تأیید با تایمفریم 1H
// --- Breakout Detection ---
var bool breakout_detected = false
if final_trend == "up" and close > resistance_level
breakout_detected := true
alert("شکست صعودی تشخیص داده شد! منتظر پولبک 🚀", alert.freq_once_per_bar)
else if final_trend == "down" and close < support_level
breakout_detected := true
alert("شکست نزولی تشخیص داده شد! منتظر پولبک 📉", alert.freq_once_per_bar)
// --- Entry and Exit Conditions ---
var float position = 0.0
var float entry_price = 0.0
var float stop_loss_price = na
var bool take_profit_long = false // Declare take_profit_long
var bool stop_loss_hit_long = false // Declare stop_loss_hit_long
var bool take_profit_short = false // Declare take_profit_short
var bool stop_loss_hit_short = false // Declare stop_loss_hit_short
risk_per_trade_percent = 2.5 // افزایش ریسک به 2.5٪ برای موقعیتهای بیشتر
if not breakout_detected
if position == 0 and is_candle_stop(final_trend)
risk_amount_usd = strategy.initial_capital * (risk_per_trade_percent / 100)
if final_trend == "up"
stop_loss_price := close * 0.975 // Stop loss at 2.5% below entry for longs
if (close - stop_loss_price) != 0
position_size_usd = risk_amount_usd / (close - stop_loss_price)
amount = position_size_usd / close
strategy.entry("Long", strategy.long, qty=amount)
position := amount
entry_price := close
else if final_trend == "down"
stop_loss_price := close * 1.025 // Stop loss at 2.5% above entry for shorts
if (stop_loss_price - close) != 0
position_size_usd = risk_amount_usd / (stop_loss_price - close)
amount = position_size_usd / close
if rsi >= rsi_overbought // RSI condition for short entry - No Change, still using RSI but not enforcing it for now - Consider removing RSI condition as well for max trades
strategy.entry("Short", strategy.short, qty=amount)
position := amount
entry_price := close
if position > 0
profit_percent_long = (close - entry_price) / entry_price * 100
profit_percent_short = (entry_price - close) / entry_price * 100
loss_percent_long = (entry_price - close) / entry_price * 100
loss_percent_short = (close - entry_price) / entry_price * 100
risk_reward_long = loss_percent_long != 0 ? profit_percent_long / loss_percent_long : (profit_percent_long != 0 ? 99999 : 0)
risk_reward_short = loss_percent_short != 0 ? profit_percent_short / loss_percent_short : (profit_percent_short != 0 ? 99999 : 0)
take_profit_long := profit_percent_long >= 7 and risk_reward_long >= 3
stop_loss_hit_long := close <= stop_loss_price
take_profit_short := profit_percent_short >= 6 and risk_reward_short >= 3 // Reduced Take Profit for Shorts to 6% - No Change
stop_loss_hit_short := close >= stop_loss_price
if (final_trend == "up" and (take_profit_long or stop_loss_hit_long)) or (final_trend == "down" and (take_profit_short or stop_loss_hit_short))
if final_trend == "up"
strategy.close("Long")
else
strategy.close("Short")
position := 0
entry_price := 0.0
breakout_detected := false
// --- Plotting EMAs and Support/Resistance Levels ---
plot(ema5, color=color.blue, title="EMA5")
plot(ema20, color=color.red, title="EMA20")
plot(ema90, color=color.green, title="EMA90")
plot(resistance_level, color=color.orange, style=plot.style_line, title="Resistance")
plot(support_level, color=color.orange, style=plot.style_line, title="Support")